
 Yahoo Finance
 Vianet Group plc's (LON:VNET) On An Uptrend But Financial Prospects Look Pretty Weak: Is The Stock Overpriced?
Vianet Group (LON:VNET) has had a great run on the share market with its stock up by a significant 11% over the last three months. However, we decided to pay close attention to its weak financials as we are doubtful that the current momentum will keep up, given the scenario. Particularly, we will be paying attention to Vianet Group's ROE today.
ROE or return on equity is a useful tool to assess how effectively a company can generate returns on the investment it received from its shareholders. In short, ROE shows the profit each dollar generates with respect to its shareholder investments.
Check out our latest analysis for Vianet Group
How To Calculate Return On Equity?
The formula for return on equity is:
Return on Equity = Net Profit (from continuing operations) ÷ Shareholders' Equity
So, based on the above formula, the ROE for Vianet Group is:
2.9% = UK£801k ÷ UK£27m (Based on the trailing twelve months to March 2024).
The 'return' refers to a company's earnings over the last year. So, this means that for every £1 of its shareholder's investments, the company generates a profit of £0.03.
What Is The Relationship Between ROE And Earnings Growth?
So far, we've learned that ROE is a measure of a company's profitability. We now need to evaluate how much profit the company reinvests or "retains" for future growth which then gives us an idea about the growth potential of the company. Generally speaking, other things being equal, firms with a high return on equity and profit retention, have a higher growth rate than firms that don’t share these attributes.
A Side By Side comparison of Vianet Group's Earnings Growth And 2.9% ROE
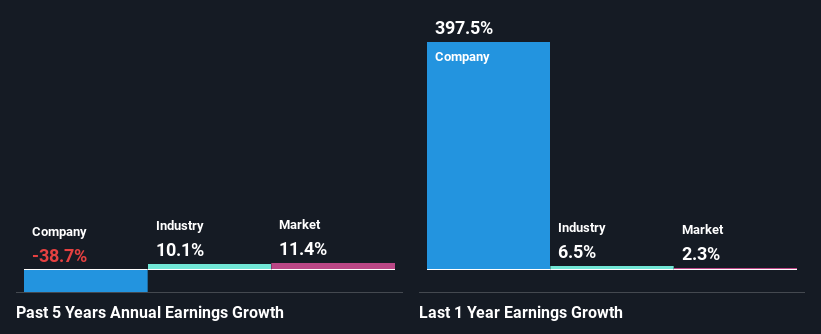
It is hard to argue that Vianet Group's ROE is much good in and of itself. Even when compared to the industry average of 11%, the ROE figure is pretty disappointing. Therefore, it might not be wrong to say that the five year net income decline of 39% seen by Vianet Group was possibly a result of it having a lower ROE. We reckon that there could also be other factors at play here. For example, the business has allocated capital poorly, or that the company has a very high payout ratio.
However, when we compared Vianet Group's growth with the industry we found that while the company's earnings have been shrinking, the industry has seen an earnings growth of 10% in the same period. This is quite worrisome.
The basis for attaching value to a company is, to a great extent, tied to its earnings growth. What investors need to determine next is if the expected earnings growth, or the lack of it, is already built into the share price. This then helps them determine if the stock is placed for a bright or bleak future. If you're wondering about Vianet Group's's valuation, check out this gauge of its price-to-earnings ratio, as compared to its industry.
Is Vianet Group Making Efficient Use Of Its Profits?
With a high three-year median payout ratio of 89% (implying that 11% of the profits are retained), most of Vianet Group's profits are being paid to shareholders, which explains the company's shrinking earnings. The business is only left with a small pool of capital to reinvest - A vicious cycle that doesn't benefit the company in the long-run. You can see the 3 risks we have identified for Vianet Group by visiting our risks dashboard for free on our platform here.
Moreover, Vianet Group has been paying dividends for at least ten years or more suggesting that management must have perceived that the shareholders prefer dividends over earnings growth.
Conclusion
Overall, we would be extremely cautious before making any decision on Vianet Group. Because the company is not reinvesting much into the business, and given the low ROE, it's not surprising to see the lack or absence of growth in its earnings. So far, we've only made a quick discussion around the company's earnings growth. So it may be worth checking this free detailed graph of Vianet Group's past earnings, as well as revenue and cash flows to get a deeper insight into the company's performance.
Have feedback on this article? Concerned about the content? Get in touch with us directly. Alternatively, email editorial-team (at) simplywallst.com.
This article by Simply Wall St is general in nature. We provide commentary based on historical data and analyst forecasts only using an unbiased methodology and our articles are not intended to be financial advice. It does not constitute a recommendation to buy or sell any stock, and does not take account of your objectives, or your financial situation. We aim to bring you long-term focused analysis driven by fundamental data. Note that our analysis may not factor in the latest price-sensitive company announcements or qualitative material. Simply Wall St has no position in any stocks mentioned.
Have feedback on this article? Concerned about the content? Get in touch with us directly. Alternatively, email editorial-team@simplywallst.com
