
 Yahoo Finance
 Is VersaPay Corporation (CVE:VPY) Overpaying Its CEO?

Craig O’Neill has been the CEO of VersaPay Corporation (CVE:VPY) since 2013. This analysis aims first to contrast CEO compensation with other companies that have similar market capitalization. Next, we’ll consider growth that the business demonstrates. And finally we will reflect on how common stockholders have fared in the last few years, as a secondary measure of performance. This process should give us an idea about how appropriately the CEO is paid.
Check out our latest analysis for VersaPay
How Does Craig O’Neill’s Compensation Compare With Similar Sized Companies?
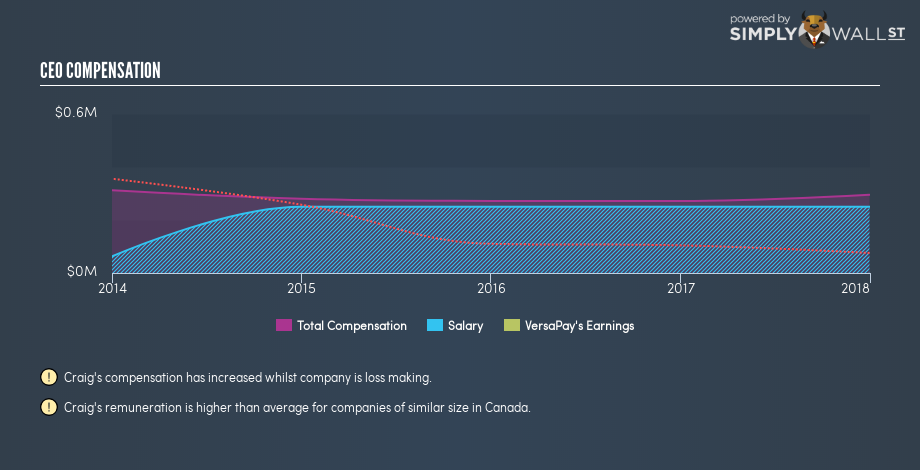
Our data indicates that VersaPay Corporation is worth CA$52m, and total annual CEO compensation is CA$295k. (This figure is for the year to 2017). We think total compensation is more important but we note that the CEO salary is lower, at CA$250k. We examined a group of similar sized companies, with market capitalizations of below CA$266m. The median CEO compensation in that group is CA$154k.
It would therefore appear that VersaPay Corporation pays Craig O’Neill more than the median CEO remuneration at companies of a similar size, in the same market. However, this fact alone doesn’t mean the remuneration is too high. We can get a better idea of how generous the pay is by looking at the performance of the underlying business.
You can see a visual representation of the CEO compensation at VersaPay, below.
Is VersaPay Corporation Growing?
On average over the last three years, VersaPay Corporation has shrunk earnings per share by 1.4% each year. Its revenue is up 101% over last year.
Investors should note that, over three years, earnings per share are down. But on the other hand, revenue growth is strong, suggesting a brighter future. These two metric are moving in different directions, so while it’s hard to be confident judging performance, we think the stock is worth watching.
It could be important to check this free visual depiction of what analysts expect for the future.
Has VersaPay Corporation Been A Good Investment?
With a total shareholder return of 9.1% over three years, VersaPay Corporation has done okay by shareholders. But they probably don’t want to see the CEO paid more than is normal for companies around the same size.
In Summary…
We compared total CEO remuneration at VersaPay Corporation with the amount paid at companies with a similar market capitalization. We found that it pays well over the median amount paid in the benchmark group.
We generally prefer to see stronger EPS growth, and we’re not particularly impressed with the total shareholder return, over the last three years. So it’s certainly hard to argue that the CEO is modestly paid, although we don’t see the remuneration as an issue. If you think CEO compensation levels are interesting you will probably really like this free visualization of insider trading at VersaPay.
Or you could feast your eyes on this interactive graph depicting past earnings, cash flow and revenue.
To help readers see past the short term volatility of the financial market, we aim to bring you a long-term focused research analysis purely driven by fundamental data. Note that our analysis does not factor in the latest price-sensitive company announcements.
The author is an independent contributor and at the time of publication had no position in the stocks mentioned. For errors that warrant correction please contact the editor at editorial-team@simplywallst.com.
