
 Yahoo Finance
 The Valmont Industries (NYSE:VMI) Share Price Has Gained 119%, So Why Not Pay It Some Attention?
The most you can lose on any stock (assuming you don't use leverage) is 100% of your money. But if you pick the right business to buy shares in, you can make more than you can lose. Take, for example Valmont Industries, Inc. (NYSE:VMI). Its share price is already up an impressive 119% in the last twelve months. We note the stock price is up 1.9% in the last seven days. And shareholders have also done well over the long term, with an increase of 70% in the last three years.
Check out our latest analysis for Valmont Industries
To paraphrase Benjamin Graham: Over the short term the market is a voting machine, but over the long term it's a weighing machine. One flawed but reasonable way to assess how sentiment around a company has changed is to compare the earnings per share (EPS) with the share price.
During the last year Valmont Industries grew its earnings per share (EPS) by 1.2%. This EPS growth is significantly lower than the 119% increase in the share price. So it's fair to assume the market has a higher opinion of the business than it a year ago.
You can see how EPS has changed over time in the image below (click on the chart to see the exact values).
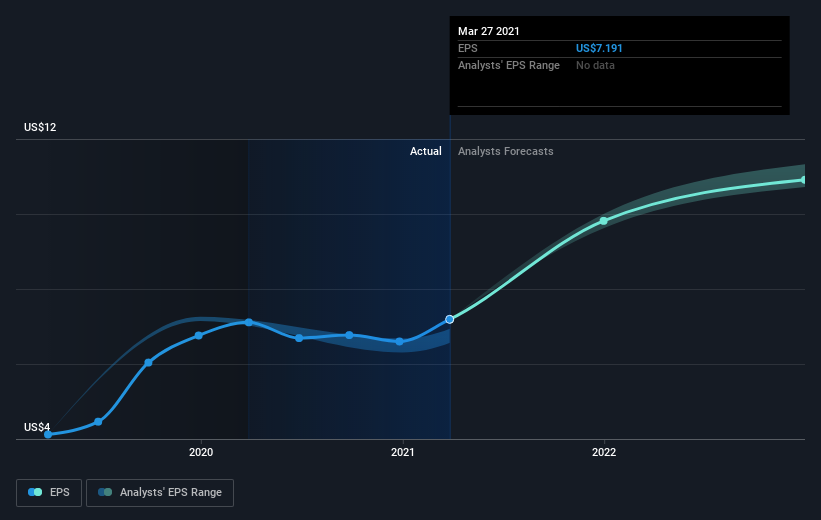
This free interactive report on Valmont Industries' earnings, revenue and cash flow is a great place to start, if you want to investigate the stock further.
What About Dividends?
As well as measuring the share price return, investors should also consider the total shareholder return (TSR). Whereas the share price return only reflects the change in the share price, the TSR includes the value of dividends (assuming they were reinvested) and the benefit of any discounted capital raising or spin-off. It's fair to say that the TSR gives a more complete picture for stocks that pay a dividend. We note that for Valmont Industries the TSR over the last year was 122%, which is better than the share price return mentioned above. And there's no prize for guessing that the dividend payments largely explain the divergence!
A Different Perspective
It's nice to see that Valmont Industries shareholders have received a total shareholder return of 122% over the last year. Of course, that includes the dividend. That's better than the annualised return of 13% over half a decade, implying that the company is doing better recently. Someone with an optimistic perspective could view the recent improvement in TSR as indicating that the business itself is getting better with time. While it is well worth considering the different impacts that market conditions can have on the share price, there are other factors that are even more important. For example, we've discovered 1 warning sign for Valmont Industries that you should be aware of before investing here.
For those who like to find winning investments this free list of growing companies with recent insider purchasing, could be just the ticket.
Please note, the market returns quoted in this article reflect the market weighted average returns of stocks that currently trade on US exchanges.
This article by Simply Wall St is general in nature. It does not constitute a recommendation to buy or sell any stock, and does not take account of your objectives, or your financial situation. We aim to bring you long-term focused analysis driven by fundamental data. Note that our analysis may not factor in the latest price-sensitive company announcements or qualitative material. Simply Wall St has no position in any stocks mentioned.
Have feedback on this article? Concerned about the content? Get in touch with us directly. Alternatively, email editorial-team (at) simplywallst.com.
