
 Yahoo Finance
 USD/JPY Forex Technical Analysis – Trend Changes to Down on Trade Through 108.280
The Dollar/Yen is edging lower on Wednesday after posting a steep sell-off for a second session on Tuesday. The selling began on Monday after the release of a weak U.S. manufacturing report. The Institute for Supply Management (ISM) said its index of national factory activity fell to a below-forecast 48.1 in November, indicating contraction in the sector.
At 04:56 GMT, the USD/JPY is trading 108.579, down 0.050 or -0.05%.
President Trump’s announcement that his administration would impose tariffs on metal imports from Argentina and Brazil and would likely impose more on a range of French goods weighed on the USD/JPY early Tuesday, but the selling accelerated after Trump said a deal with China might have to wait until after the 2020 U.S. presidential election.
Daily Swing Chart Technical Analysis
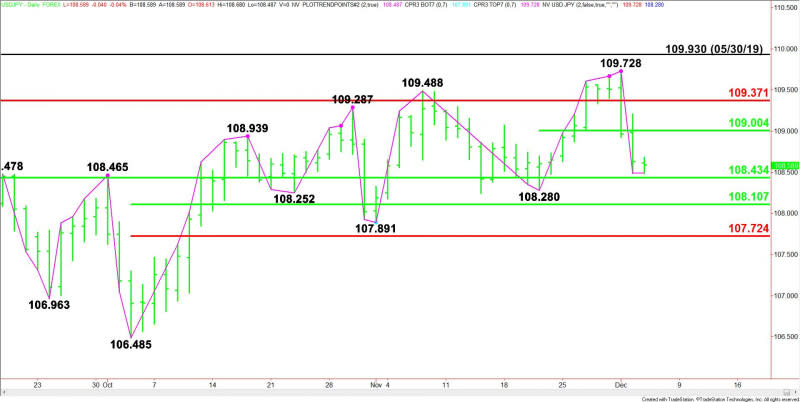
The main trend is up according to the daily swing chart, however, momentum shifted to the downside with the formation of a closing price reversal top on December 2 at 109.728 and its subsequent confirmation on Tuesday.
A trade through 108.280 will change the main trend to down. A move through 109.728 will negate the closing price reversal top and signal a resumption of the uptrend.
The first downside target is a long-term 50% level at 108.434.
The main range is 106.485 to 109.728. Its retracement zone at 108.107 to 107.724 is the next potential downside target.
The short-term range is 108.280 to 109.728. Its 50% level at 109.004 is the first resistance target. The long-term Fibonacci level at 109.371 is the second potential resistance target.
Daily Swing Chart Technical Forecast
Based on the early price action, the direction of the USD/JPY on Wednesday is likely to be determined by trader reaction to the 50% level at 108.434.
Bearish Scenario
A sustained move under 108.434 will indicate the selling is getting stronger. This could trigger a break into the main bottom at 108.280.
Taking out 108.280 will change the main trend to down. This could lead to a quick break into the 50% level at 108.107. If this fails then look for the selling to extend into the next main bottom at 107.891 and the Fibonacci level at 107.724.
Bullish Scenario
A sustained move over 108.434 will signal the presence of buyers. If this move creates enough upside momentum then look for the rally to possibly extend into the short-term 50% level at 109.004.
This article was originally posted on FX Empire
More From FXEMPIRE:
U.S. Dollar Index Futures (DX) Technical Analysis – Strengthens Over 97.690, Weakens Under 97.500
We Hope the Swift EUR/USD Recovery Didn’t Leave You in the Dust
EUR/USD Daily Forecast – Euro Eases Lower Following Services PMI Data
USD/JPY Forex Technical Analysis – Trend Changes to Down on Trade Through 108.280
