
 Yahoo Finance
 USD/CAD Daily Forecast – Overhead Ichimoku Clouds Confining Positive Moves
The Loonie pair rang the opening bell on Monday near 1.3078 level and continued to provide some slow-growing upward movements. Anyhow, the gains for the pair got capped near 1.3083 resistance level in the Asian trading session. Still, the USD/CAD pair needs to fuel-in for 50-60 more pips to recover from Friday’s steep losses.
Updates on Crude front
Canada’s top export item is Crude Oil. Hence, any volatility in the commodity’s prices does have a significant impact on the pair’s daily movements. During the Asian session, the Oil prices were trading near $57.68 bbl supported by strong US jobs data growth. Anyhow, the uncertainties around the US-Sino trade dispute let the bears keep their fingers crossed, lowering commodity demand.
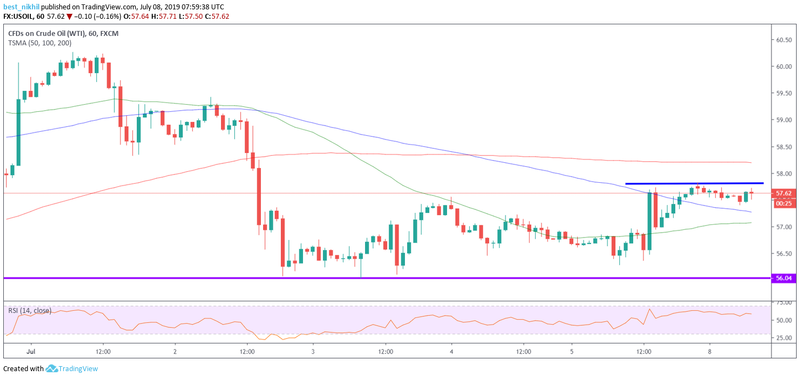
Iran said on Sunday that it would shortly boost its uranium enrichment above a cap set by a landmark 2015 nuclear deal, prompting a warning ‘to be careful’ from U.S. President Donald Trump, who pulled out of the pact last year. On the technical front, the 50-day and 100-day near-term SMA provided the pair some support to showcase short uptrends. However, on moving upwards, the significant 200-day SMA stalled near $58.20 bbl might get activated.
Significant Economic Events
The economic docket appears light weighted amid lack of significant events. There are also no Crude prices impacting events for today. However, the market participants stay anticipated ahead of Fed’s Chair Powell’s speech scheduled on Tuesday. Friday’s Payrolls seemed to influence on the interest rate cut decision-making. Meantime, US President Donald Trump continues to pressurize the Fed for a rate cut and is underway to replace Powell soon.
Technical Analysis
2-Hour Chart
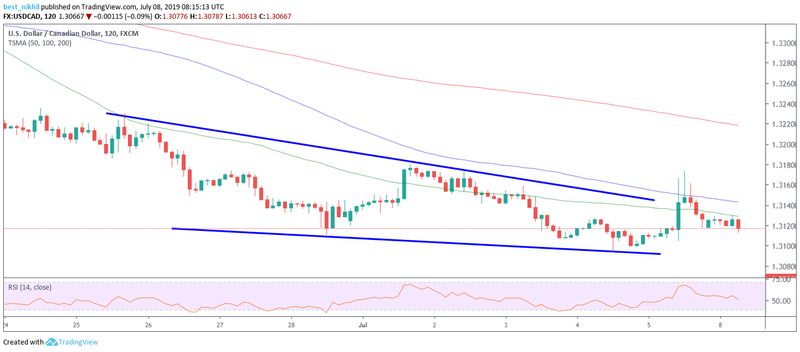
The Loonie pair might continue to drown as there remain multiple barriers on the upside. Since the start of July, the 50-day and 100-day SMA confluence are trying hard to confine the pair’s positive moves. Suppose, even if the pair breaches the aforementioned resistance region, then that would enable the next target towards 200-day SMA at 1.3194 mark. Although there somewhat appears a falling wedge formation, signaling a bullish uptrend, rest of the things fall out-of-place disapproving this positive stance.
1-Day Chart
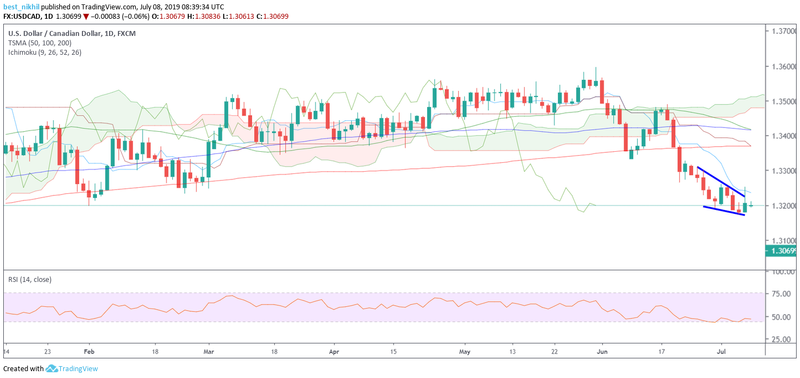
As per the Ichimoku Clouds technical indicator, the main trend remains bearish on a broader time scale. The Clouds hovered well above the Loonie pair, suggesting the downtrend to persist in the upcoming sessions. Also, the overhead moving, base line and conversion line, confirmed the negative outlook for the pair’s future movements. The pair had already broken the healthy February 1.3065 support handle and was lingering near the same vicinity fetching for stability. Meantime, the RSI indicated near 32.21 points, revealing an oversold condition.
This article was originally posted on FX Empire
More From FXEMPIRE:
Bitcoin Cash – ABC, Litecoin and Ripple Daily Analysis – 09/07/19
Natural Gas Price Forecast – Natural gas runs into resistance
S&P 500 Price Forecast – Stock markets continue to hover around the highs
Forex Daily Recap – Turkish Lira Fell as Edrogan Fired Central Bank Governor
Gold Price Prediction – Prices Trade Sideways but Momentum is Negative
