
 Yahoo Finance
 USD/CAD Daily Forecast – Overhead Ichimoku Clouds Restricting Upside
After touching the 1.3094 resistance mark yesterday, the Loonie pair had made a sharp breakdown, clinging back to the 10-month bottom. Such kind of pessimism had come following dovish comments by Fed’s John Williams. In a speech, last day, Williams mentioned that the Central bankers need to “act quickly,” considering the slowly growing economy. Williams added that he expects a 50 bps rate cut soon, sending some serious shivers to the market participants.
However, laterwards, Fed Officials came in to make clarifications over his comments. The Officials said that “This was an academic speech on 20 years of research. It was not about potential policy actions at the upcoming FOMC meeting,”
Meanwhile, Crude prices rose more than 2% today as the US Navy downed an Iranian drone, elevating Middle East tensions. Indications of a Fed rate cut also helped the oil prices drove higher.
Significant Economic Events
The spotlight for the day flashes over the crucial Canadian May MoM Retail Sales data. The market keeps a bullish stance over this high volatile event, expecting a 0.2% rise over the previous 0.1%. Also, the Street analysts expect the Retail Sales data that excludes Autos to report 0.3% growth this time.
On the USD side, though there are numerous events, most of them remain low volatile ones. However, the July Michigan Consumer Sentiment Index is something worth watching. The consensus estimate this index to print a slight rise, reporting 98.5 points over the last 98.2 points. Few moments post this event release, Fed’s Bullard would provide his stance over the US economic outlook.
At around 17:00 GMT, traders await the Baker Hughes US Oil Rig Count data release that had recorded 784 last time.
Technical Analysis
1-Day Chart
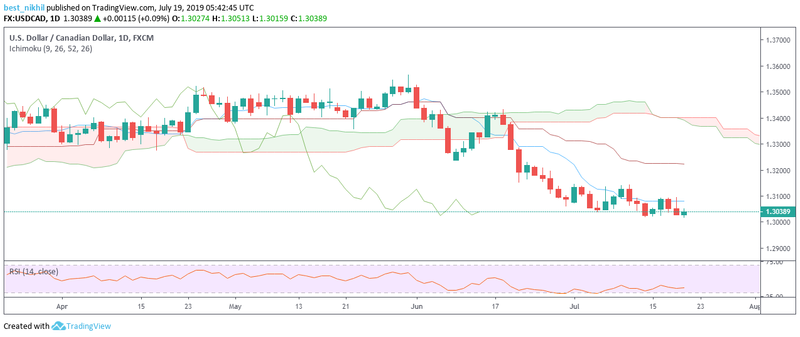
As per the Ichimoku Clouds technical indicator, the primary trend might continue to remain bearish in the upcoming sessions. The Ichimoku Clouds cast shadows over the USD/CAD pair, staying above it. Also, the base line and conversion line kept moving near 1.3200 and 1.3100 levels respectively when the pair traded near 1.3038 level. The RSI appeared dried out, indicating 37.39 oversold status.
4-Hour Chart
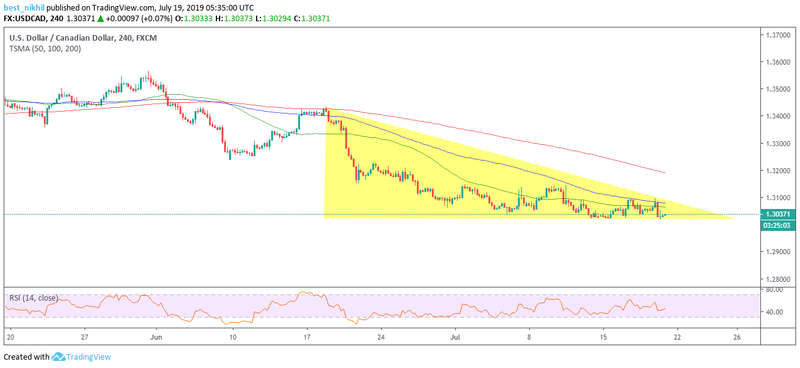
Even today, the Loonie pair appeared to move, remaining intact within the 1-month old descending triangle pattern. The overhead resistance confluence consisting of the 50-day and 100-day SMA was restricting the upside. Anyhow, drift on the north side above this aforementioned resistance confluence would activate the 200-day SMA, hovering near 1.3200 level. At any point in time, the pair might showcase a breakout, taking up a bearish trend.
This article was originally posted on FX Empire
More From FXEMPIRE:
Natural Gas Price Prediction – Prices Fall on Higher Production Forecast
Gold Weekly Price Forecast – Gold markets continue to test resistance
Rate Cuts Move Gold, Bullish Crude Specs Bail, Low Demand Pressures Nat Gas
Silver Weekly Price Forecast – Silver markets exploded to the upside
US Stocks Decline after WSJ Report Says Fed Will Make Less-Aggressive Rate Cut
Crude Oil Price Update – Traders Trying to Establish Support at $55.62 to $54.50 Retracement Zone
