
 Yahoo Finance
 US Stocks Break Records
It's also the second-best performance on record when compared to other election episodes.
Investors are now attempting to determine the direction of the Federal Reserve's monetary policy and monitoring corporate earnings.
As the 2024 presidential election approaches, market analysts are closely scrutinizing historical trends and seasonal patterns to gauge the S&P 500's potential trajectory. Analyzing the S&P 500 index performance during election years since 1932 indicates that, with the exception of 1976, the index is poised to achieve its best performance to date. However, there's a notable discrepancy in the index's results between the first and second half of the year. Based on data from FactSet, when the S&P 500 index gains over 11% in the first half of an election year, the average return in the second half is just 3%. Statistically, a strong first half (>11%) suggests a potential consolidation in the second half.
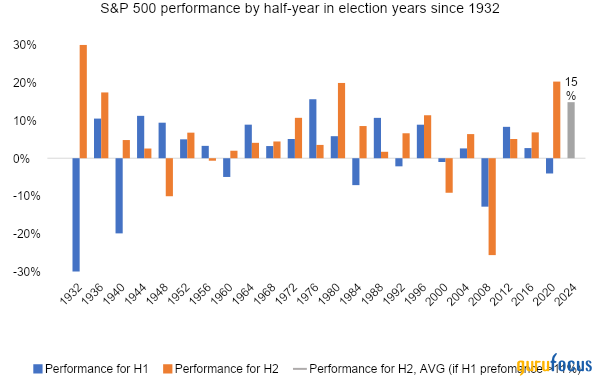
Source: FactSet
Given that election years are fewer in number than annual observations, it's beneficial to consider yearly patterns over the entire observation period. According to the chart below, the current year's index performance is not extreme. Since 1929, there have been 13 periods when the year-to-date result exceeded the current mark of 15%. However, the pattern of underperformance in the second half persists, with the average return for the S&P 500 standing at 2.3% when the first half delivers a 15% gain.
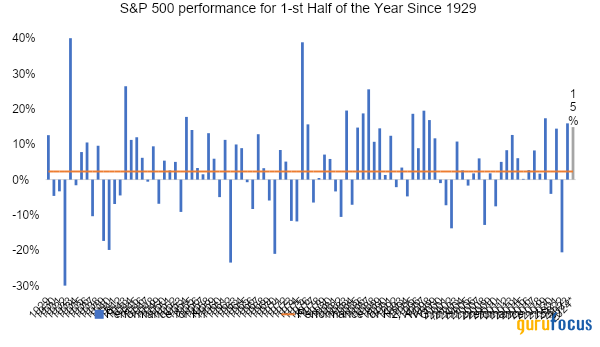
Source: FactSet
Overall, the realization of the above-mentioned seasonal pattern indicates potential investor caution, emphasizing the importance of stock picking. Additionally, from a statistical perspective, investors may not anticipate a broadening of the market rally equal-weighted indices (RSP) typically underperform in such periods.
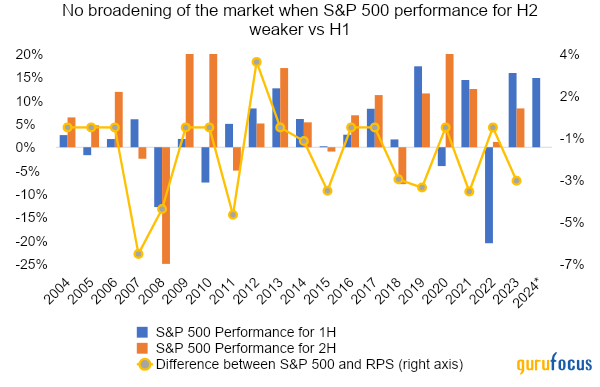
Source: FactSet, Freedom Broker analysis
It is crucial to remember that seasonal patterns serve as tools to inform investment decisions rather than as absolute determinants of market direction. Sentiment and unforeseen events can always disrupt historical trends. Despite the potential for near-term volatility, Freedom Broker expects a positive S&P 500 index trend through the end of 2024, index can reach 5,640 points (weighted number) and 5,980 points (under favorable market conditions).
Key growth drivers include a robust EPS recovery (amid improving revenue trends and margin growth). Components of higher revenue growth include elevated inflation levels and continued recovery momentum in significant market niches (semiconductors, online advertising, capital markets, etc.). Factors driving improved margins for S&P 500 companies include: a low base effect (margins were under pressure for two consecutive years, and the average margin change during recovery periods is 1.5%), and strong momentum in the IT and communications sectors.
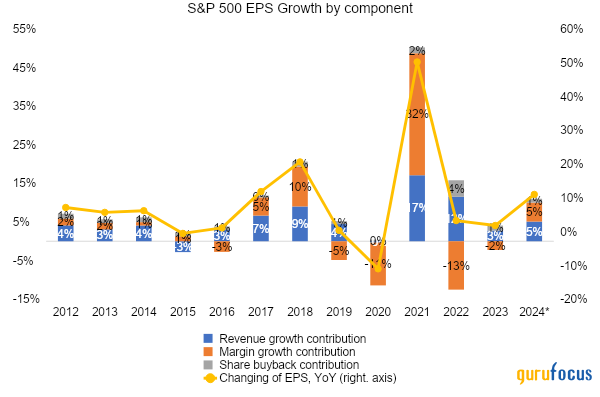
Source: FactSet, Freedom Broker analysis
*Freedom Broker's forecast
The first-quarter earnings results provided a solid foundation for second-quarter gains. S&P 500 companies reported year-over-year earnings growth of 6%, exceeding expectations by 7.7%. About 80% of companies reported earnings above expectations. The strong quarterly results confirmed the resilience of EPS expectations for the current year. This performance reinforced positive EPS expectations for the year. While the S&P 500's performance in the 2-nd quarter was concentrated in a few names, notably NVIDIA (NVDA), we note an improvement in the index's "growth foundation" (as shown in the chart below), driven by an increased contribution from EPS expectations change versus changes in the forward P/E multiple.
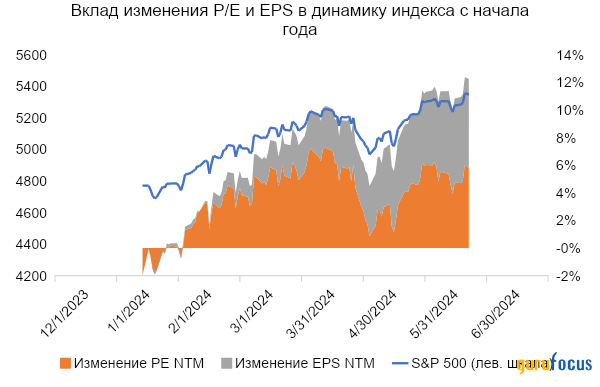
Source: FactSet, Freedom Broker analysis
EPS NTM represents the forward 12-month expected EPS, which fluctuates based on both actual EPS growth and the temporal effectas time progresses, more distant future values are included in the NTM EPS calculation. The recent June FOMC meeting put pressure on the market: yields rose across the curve, and stock indices slightly retreated from local peaks following the May CPI data release. However, the Fed's forecasts suggest the Goldilocks scenario remains in play. The GDP forecast was adjusted only slightly, the unemployment forecast was slightly revised for 2025, and the core PCE price index forecast was increased, likely reflecting a lag effect. The Fed's rate forecast was similarly adjusted to the PCE forecast, with only one rate cut expected this year (down from three cuts previously). However, accelerated monetary policy easing is anticipated in 2025, with a 100 bps rate cut (up from 75 bps previously).
Recent Fed officials' comments have been cautiously conservative, but markets have interpreted the Fed's data dependency as bidirectional. Lower inflation data for April and May, combined with favorable labor market trends and signs of slowing consumer demand, could prompt the Fed to ease monetary policy in 2024. Even if the Fed cuts rates only once in 2024, the market is likely to respond positively anticipating lower rates in the future.
In summary, the combination of a strong economy, easing inflation, and accommodative Fed policy, coupled with robust EPS growth expectations, paints a bullish picture for the S&P 500. However, investors should be prepared for potential near-term volatility, particularly in the second half of the year.
This article first appeared on GuruFocus.
