
 Yahoo Finance
 The Unpopular Laggards Will Have Their Day Again
I’ll show you how a popular breadth reading signals a significant gap between the returns of cap-weighted stocks relative to the rest of the market. Then I’ll illustrate how the unpopular laggards will have their day again, probably sooner rather than later.
More Stocks Are Being Sold Than Bought
When most equities participate in a rally, breadth is strong. But currently, a handful of names are pushing markets upward.
For example, the trusty MAPsignals Big Money Index is falling. That indicates more stocks are being sold than bought by institutional investors.
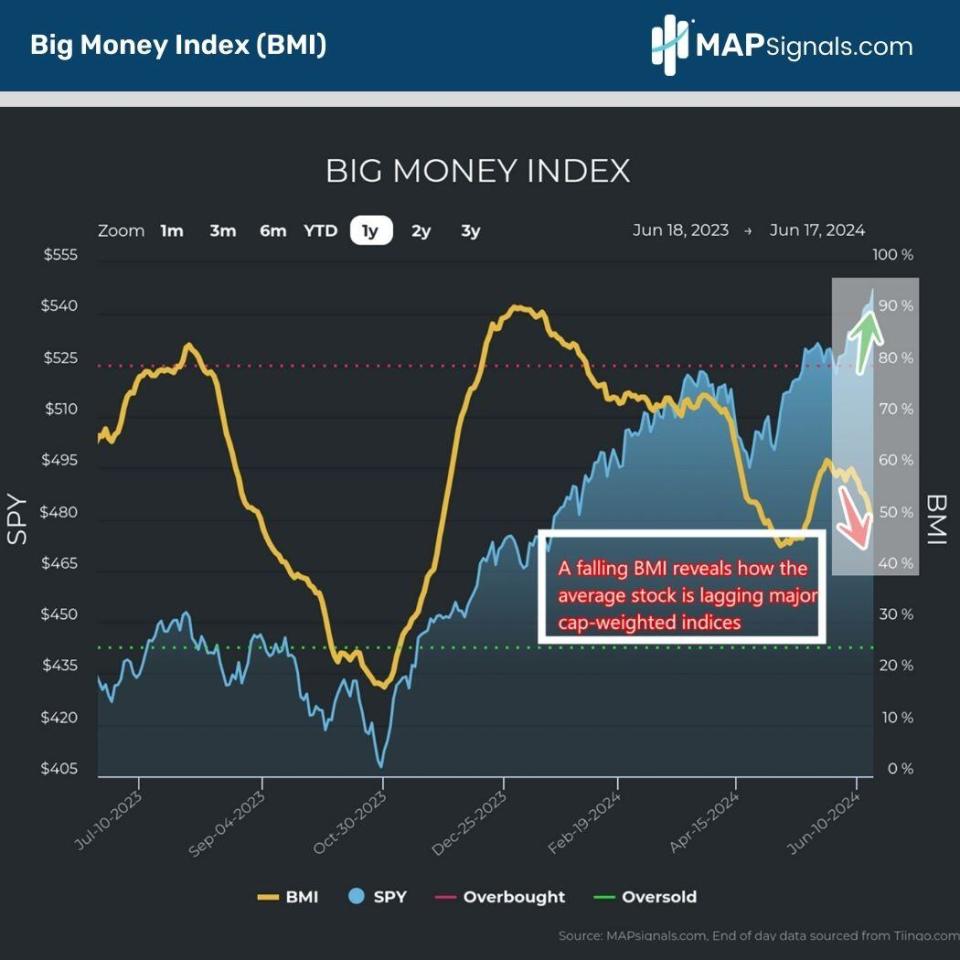
Looking at different segments of the S&P 500, we see massive underperformance by the average stock.
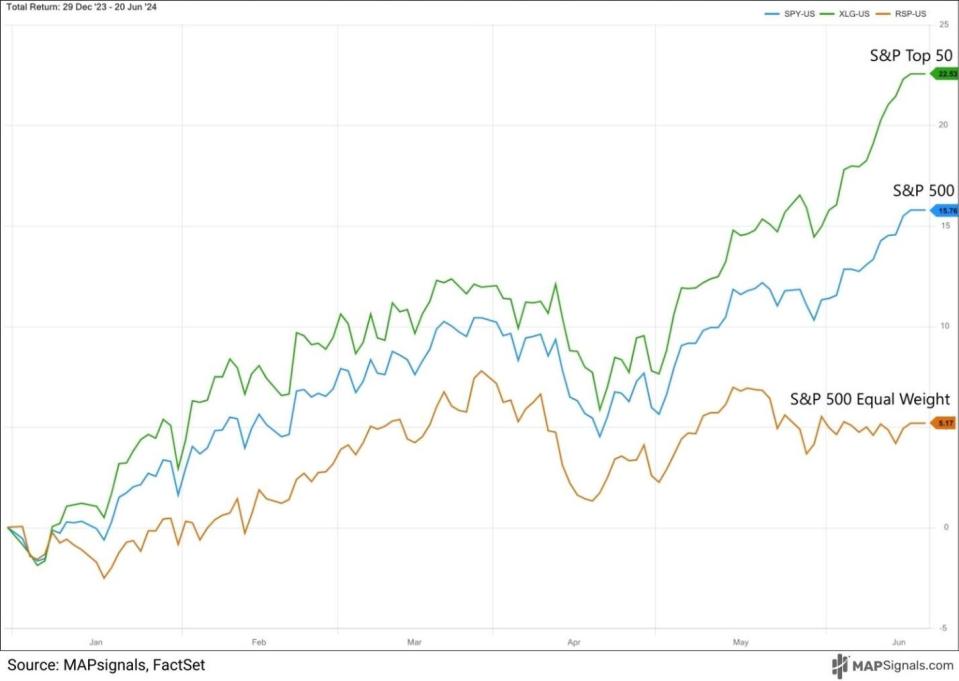
As of this writing, the Invesco S&P 500 Top 50 ETF (XLG), which measures the top 50 stocks in the S&P 500 (SPX), is up 22.53% in 2024.
The entire index as measured by the SPDR S&P 500 ETF Trust (SPY) or the Vanguard S&P 500 ETF (VOO) is up 15.76%.
And the Invesco S&P 500 Equal Weight ETF (RSP), which holds equal weights of each stock in the S&P 500, is up just 5.17%:
Another way to look at this situation is by measuring breadth via the RSP/SPY ratio. This measure examines the equal-weight S&P 500 to the index itself, which is weighted by market capitalization.
Right now, the RSP/SPY ratio is nearly 30%, a level not seen since 2008:
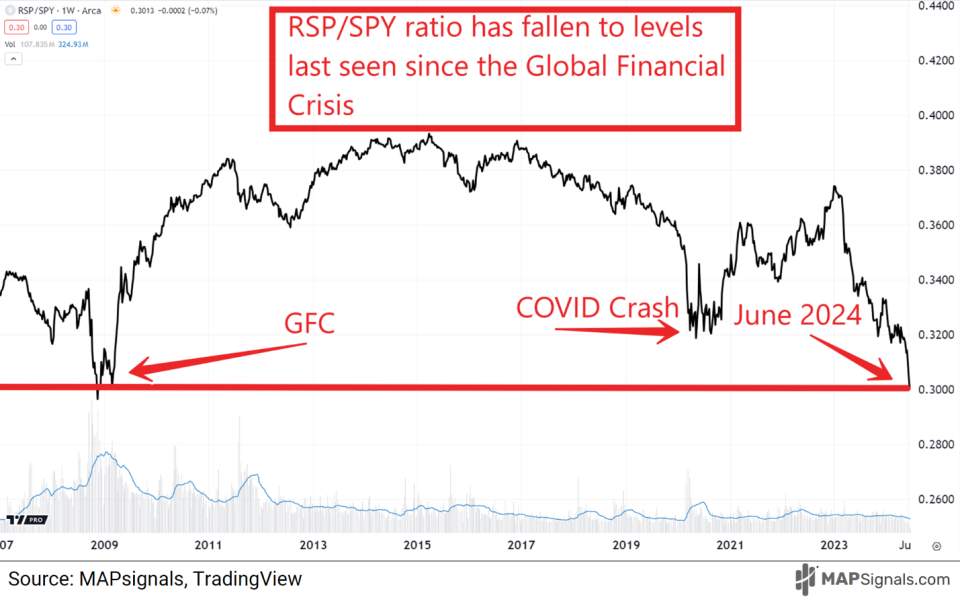
When this ratio dips low, it’s usually during times of market weakness. But we recently hit all-time highs, so that isn’t really the case now. Thus, I think we’re setting up for a monster reversion trade.
The Unpopular Laggards Will Have Their Day Again
MAPsignals’ evidence-based research often contradicts popular narratives. So, before you dump underperforming stocks, review the following data suggesting you should sit tight.
We singled out the 201 trading days since 2007 when the RSP/SPY ratio fell below 32%. In general, the S&P 500 (SPY) did fine…but the equal-weight index (RSP) soared:
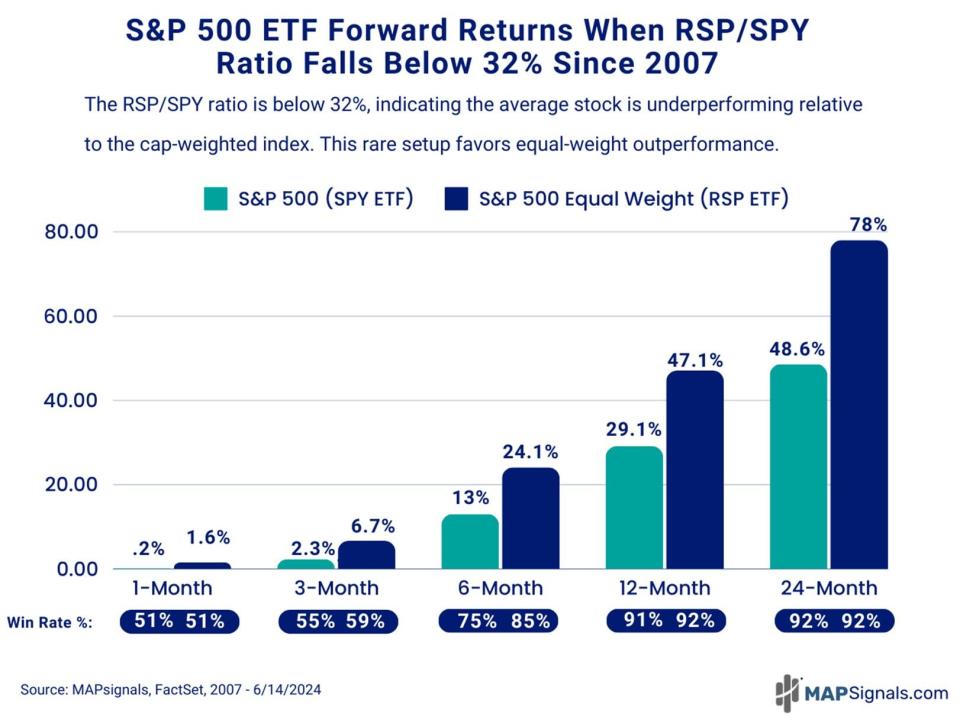
When the RSP/SPY ratio dips to 31% or lower (even worse breadth), the forward equal-weight returns are even better:
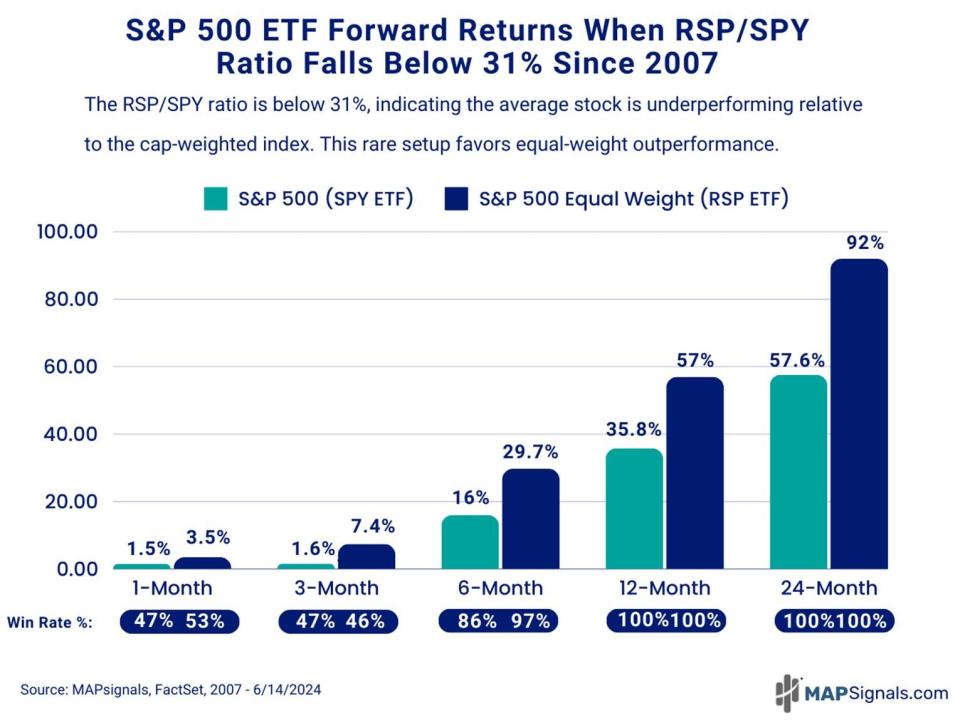
This means the average stock (not a top-50 behemoth) is poised to gain a lot! Notice the win rates on that second chart a year and two years out – they’re at 100%!
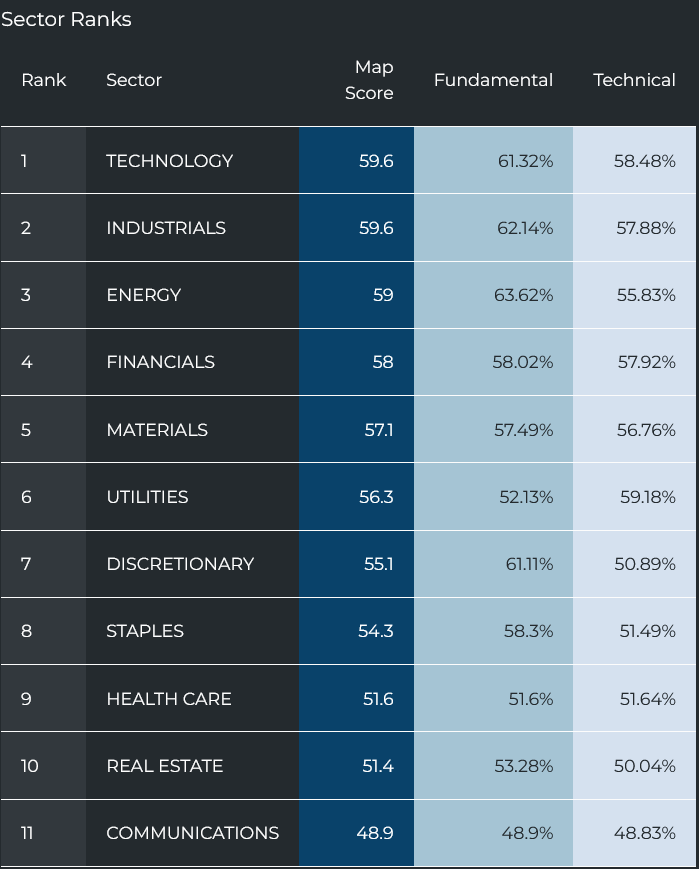
A monster reversion trade is likely on the horizon. The “unloved” sectors in the middle and bottom of our sector rankings could be set to rise much higher:
The market rally can continue, especially if most stocks begin to participate. Breadth is bad right now, but that usually doesn’t last and sets up well for the laggards to rise again.
Once that starts, MAPsignals data will be all over it. We reveal tomorrow’s winners today. Don’t wait for the media to blow the bull whistle or you’ll miss the train.
If you’re a serious investor, Registered Investment Advisor (RIA), or a money manager looking for hedge-fund quality research, get started with a MAP PRO subscription today.
This article was originally posted on FX Empire
