
 Yahoo Finance
 Unpleasant Surprises Could Be In Store For IONOS Group SE's (ETR:IOS) Shares
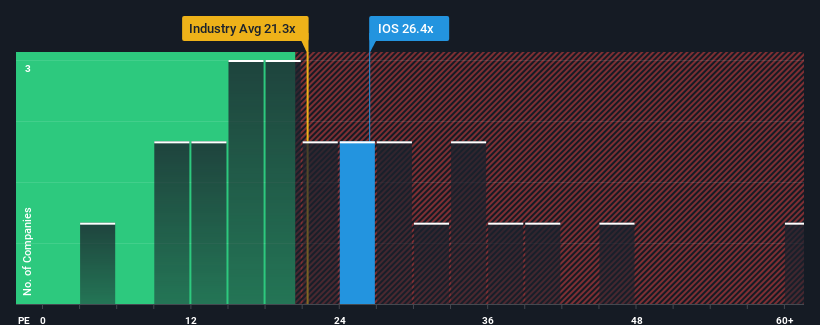
IONOS Group SE's (ETR:IOS) price-to-earnings (or "P/E") ratio of 26.4x might make it look like a strong sell right now compared to the market in Germany, where around half of the companies have P/E ratios below 17x and even P/E's below 9x are quite common. Although, it's not wise to just take the P/E at face value as there may be an explanation why it's so lofty.
With earnings growth that's superior to most other companies of late, IONOS Group has been doing relatively well. The P/E is probably high because investors think this strong earnings performance will continue. If not, then existing shareholders might be a little nervous about the viability of the share price.
View our latest analysis for IONOS Group
Want the full picture on analyst estimates for the company? Then our free report on IONOS Group will help you uncover what's on the horizon.
How Is IONOS Group's Growth Trending?
The only time you'd be truly comfortable seeing a P/E as steep as IONOS Group's is when the company's growth is on track to outshine the market decidedly.
Retrospectively, the last year delivered an exceptional 21% gain to the company's bottom line. Still, incredibly EPS has fallen 100% in total from three years ago, which is quite disappointing. So unfortunately, we have to acknowledge that the company has not done a great job of growing earnings over that time.
Shifting to the future, estimates from the eight analysts covering the company suggest earnings growth is heading into negative territory, declining 81% each year over the next three years. That's not great when the rest of the market is expected to grow by 13% per year.
With this information, we find it concerning that IONOS Group is trading at a P/E higher than the market. Apparently many investors in the company reject the analyst cohort's pessimism and aren't willing to let go of their stock at any price. There's a very good chance these shareholders are setting themselves up for future disappointment if the P/E falls to levels more in line with the negative growth outlook.
What We Can Learn From IONOS Group's P/E?
Generally, our preference is to limit the use of the price-to-earnings ratio to establishing what the market thinks about the overall health of a company.
Our examination of IONOS Group's analyst forecasts revealed that its outlook for shrinking earnings isn't impacting its high P/E anywhere near as much as we would have predicted. When we see a poor outlook with earnings heading backwards, we suspect the share price is at risk of declining, sending the high P/E lower. This places shareholders' investments at significant risk and potential investors in danger of paying an excessive premium.
Before you settle on your opinion, we've discovered 2 warning signs for IONOS Group (1 is a bit unpleasant!) that you should be aware of.
You might be able to find a better investment than IONOS Group. If you want a selection of possible candidates, check out this free list of interesting companies that trade on a low P/E (but have proven they can grow earnings).
Have feedback on this article? Concerned about the content? Get in touch with us directly. Alternatively, email editorial-team (at) simplywallst.com.
This article by Simply Wall St is general in nature. We provide commentary based on historical data and analyst forecasts only using an unbiased methodology and our articles are not intended to be financial advice. It does not constitute a recommendation to buy or sell any stock, and does not take account of your objectives, or your financial situation. We aim to bring you long-term focused analysis driven by fundamental data. Note that our analysis may not factor in the latest price-sensitive company announcements or qualitative material. Simply Wall St has no position in any stocks mentioned.
Join A Paid User Research Session
You’ll receive a US$30 Amazon Gift card for 1 hour of your time while helping us build better investing tools for the individual investors like yourself. Sign up here
