
 Yahoo Finance
 Are Universal Display Corporation’s (NASDAQ:OLED) High Returns Really That Great?

Today we are going to look at Universal Display Corporation (NASDAQ:OLED) to see whether it might be an attractive investment prospect. Specifically, we'll consider its Return On Capital Employed (ROCE), since that will give us an insight into how efficiently the business can generate profits from the capital it requires.
First up, we'll look at what ROCE is and how we calculate it. Second, we'll look at its ROCE compared to similar companies. Then we'll determine how its current liabilities are affecting its ROCE.
Return On Capital Employed (ROCE): What is it?
ROCE measures the 'return' (pre-tax profit) a company generates from capital employed in its business. All else being equal, a better business will have a higher ROCE. Ultimately, it is a useful but imperfect metric. Author Edwin Whiting says to be careful when comparing the ROCE of different businesses, since 'No two businesses are exactly alike.
So, How Do We Calculate ROCE?
Analysts use this formula to calculate return on capital employed:
Return on Capital Employed = Earnings Before Interest and Tax (EBIT) ÷ (Total Assets - Current Liabilities)
Or for Universal Display:
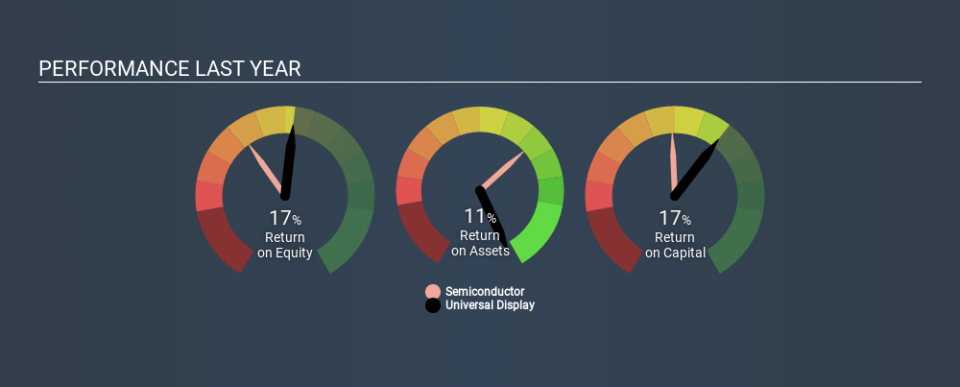
0.17 = US$158m ÷ (US$1.1b - US$162m) (Based on the trailing twelve months to December 2019.)
So, Universal Display has an ROCE of 17%.
See our latest analysis for Universal Display
Is Universal Display's ROCE Good?
When making comparisons between similar businesses, investors may find ROCE useful. Universal Display's ROCE appears to be substantially greater than the 8.9% average in the Semiconductor industry. I think that's good to see, since it implies the company is better than other companies at making the most of its capital. Regardless of where Universal Display sits next to its industry, its ROCE in absolute terms appears satisfactory, and this company could be worth a closer look.
Our data shows that Universal Display currently has an ROCE of 17%, compared to its ROCE of 12% 3 years ago. This makes us think the business might be improving. You can see in the image below how Universal Display's ROCE compares to its industry. Click to see more on past growth.
Remember that this metric is backwards looking - it shows what has happened in the past, and does not accurately predict the future. ROCE can be deceptive for cyclical businesses, as returns can look incredible in boom times, and terribly low in downturns. This is because ROCE only looks at one year, instead of considering returns across a whole cycle. Future performance is what matters, and you can see analyst predictions in our free report on analyst forecasts for the company.
What Are Current Liabilities, And How Do They Affect Universal Display's ROCE?
Short term (or current) liabilities, are things like supplier invoices, overdrafts, or tax bills that need to be paid within 12 months. The ROCE equation subtracts current liabilities from capital employed, so a company with a lot of current liabilities appears to have less capital employed, and a higher ROCE than otherwise. To check the impact of this, we calculate if a company has high current liabilities relative to its total assets.
Universal Display has total assets of US$1.1b and current liabilities of US$162m. As a result, its current liabilities are equal to approximately 14% of its total assets. Low current liabilities are not boosting the ROCE too much.
The Bottom Line On Universal Display's ROCE
This is good to see, and with a sound ROCE, Universal Display could be worth a closer look. Universal Display looks strong on this analysis, but there are plenty of other companies that could be a good opportunity . Here is a free list of companies growing earnings rapidly.
Universal Display is not the only stock that insiders are buying. For those who like to find winning investments this free list of growing companies with recent insider purchasing, could be just the ticket.
If you spot an error that warrants correction, please contact the editor at editorial-team@simplywallst.com. This article by Simply Wall St is general in nature. It does not constitute a recommendation to buy or sell any stock, and does not take account of your objectives, or your financial situation. Simply Wall St has no position in the stocks mentioned.
We aim to bring you long-term focused research analysis driven by fundamental data. Note that our analysis may not factor in the latest price-sensitive company announcements or qualitative material. Thank you for reading.
