
 Yahoo Finance
 United Parcel Service's (NYSE:UPS) three-year earnings growth trails the 30% YoY shareholder returns
It might seem bad, but the worst that can happen when you buy a stock (without leverage) is that its share price goes to zero. But when you pick a company that is really flourishing, you can make more than 100%. For example, the United Parcel Service, Inc. (NYSE:UPS) share price has soared 101% in the last three years. Most would be happy with that. In the last week the share price is up 3.5%.
On the back of a solid 7-day performance, let's check what role the company's fundamentals have played in driving long term shareholder returns.
Check out our latest analysis for United Parcel Service
While markets are a powerful pricing mechanism, share prices reflect investor sentiment, not just underlying business performance. One flawed but reasonable way to assess how sentiment around a company has changed is to compare the earnings per share (EPS) with the share price.
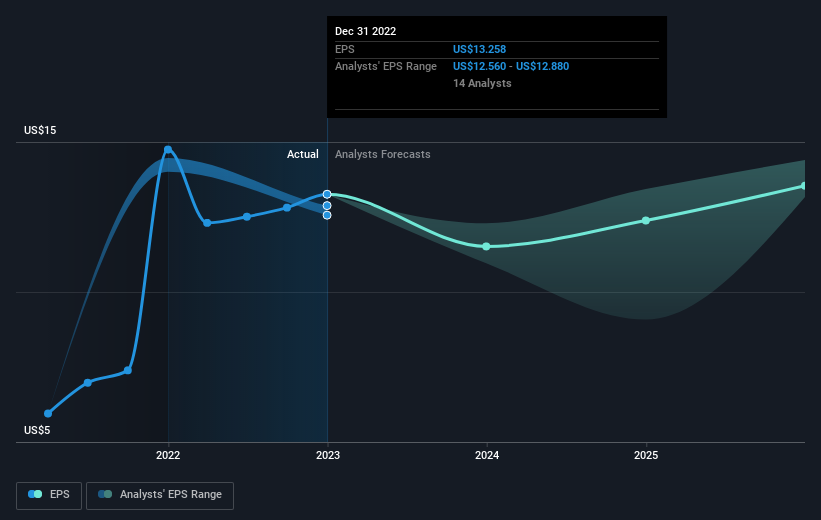
During three years of share price growth, United Parcel Service achieved compound earnings per share growth of 38% per year. The average annual share price increase of 26% is actually lower than the EPS growth. So one could reasonably conclude that the market has cooled on the stock.
You can see below how EPS has changed over time (discover the exact values by clicking on the image).
It is of course excellent to see how United Parcel Service has grown profits over the years, but the future is more important for shareholders. If you are thinking of buying or selling United Parcel Service stock, you should check out this FREE detailed report on its balance sheet.
What About Dividends?
As well as measuring the share price return, investors should also consider the total shareholder return (TSR). The TSR is a return calculation that accounts for the value of cash dividends (assuming that any dividend received was reinvested) and the calculated value of any discounted capital raisings and spin-offs. It's fair to say that the TSR gives a more complete picture for stocks that pay a dividend. In the case of United Parcel Service, it has a TSR of 119% for the last 3 years. That exceeds its share price return that we previously mentioned. And there's no prize for guessing that the dividend payments largely explain the divergence!
A Different Perspective
United Parcel Service shareholders are down 12% over twelve months (even including dividends), which isn't far from the market return of -12%. Longer term investors wouldn't be so upset, since they would have made 17%, each year, over five years. If the fundamental data remains strong, and the share price is simply down on sentiment, then this could be an opportunity worth investigating. While it is well worth considering the different impacts that market conditions can have on the share price, there are other factors that are even more important. To that end, you should learn about the 3 warning signs we've spotted with United Parcel Service (including 1 which is concerning) .
Of course United Parcel Service may not be the best stock to buy. So you may wish to see this free collection of growth stocks.
Please note, the market returns quoted in this article reflect the market weighted average returns of stocks that currently trade on American exchanges.
Have feedback on this article? Concerned about the content? Get in touch with us directly. Alternatively, email editorial-team (at) simplywallst.com.
This article by Simply Wall St is general in nature. We provide commentary based on historical data and analyst forecasts only using an unbiased methodology and our articles are not intended to be financial advice. It does not constitute a recommendation to buy or sell any stock, and does not take account of your objectives, or your financial situation. We aim to bring you long-term focused analysis driven by fundamental data. Note that our analysis may not factor in the latest price-sensitive company announcements or qualitative material. Simply Wall St has no position in any stocks mentioned.
Join A Paid User Research Session
You’ll receive a US$30 Amazon Gift card for 1 hour of your time while helping us build better investing tools for the individual investors like yourself. Sign up here
