
 Yahoo Finance
 We Like These Underlying Trends At Hemisphere Energy (CVE:HME)

There are a few key trends to look for if we want to identify the next multi-bagger. In a perfect world, we'd like to see a company investing more capital into its business and ideally the returns earned from that capital are also increasing. Basically this means that a company has profitable initiatives that it can continue to reinvest in, which is a trait of a compounding machine. Speaking of which, we noticed some great changes in Hemisphere Energy's (CVE:HME) returns on capital, so let's have a look.
What is Return On Capital Employed (ROCE)?
If you haven't worked with ROCE before, it measures the 'return' (pre-tax profit) a company generates from capital employed in its business. Analysts use this formula to calculate it for Hemisphere Energy:
Return on Capital Employed = Earnings Before Interest and Tax (EBIT) ÷ (Total Assets - Current Liabilities)
0.15 = CA$8.7m ÷ (CA$58m - CA$1.3m) (Based on the trailing twelve months to June 2020).
Thus, Hemisphere Energy has an ROCE of 15%. In absolute terms, that's a satisfactory return, but compared to the Oil and Gas industry average of 6.0% it's much better.
View our latest analysis for Hemisphere Energy
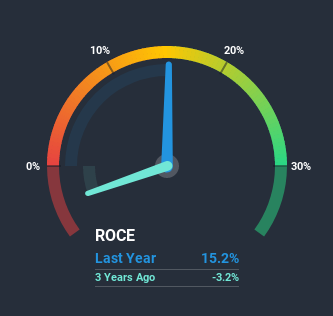
Historical performance is a great place to start when researching a stock so above you can see the gauge for Hemisphere Energy's ROCE against it's prior returns. If you're interested in investigating Hemisphere Energy's past further, check out this free graph of past earnings, revenue and cash flow.
What Does the ROCE Trend For Hemisphere Energy Tell Us?
We're delighted to see that Hemisphere Energy is reaping rewards from its investments and is now generating some pre-tax profits. About five years ago the company was generating losses but things have turned around because it's now earning 15% on its capital. In addition to that, Hemisphere Energy is employing 64% more capital than previously which is expected of a company that's trying to break into profitability. This can tell us that the company has plenty of reinvestment opportunities that are able to generate higher returns.
In another part of our analysis, we noticed that the company's ratio of current liabilities to total assets decreased to 2.2%, which broadly means the business is relying less on its suppliers or short-term creditors to fund its operations. This tells us that Hemisphere Energy has grown its returns without a reliance on increasing their current liabilities, which we're very happy with.
The Bottom Line On Hemisphere Energy's ROCE
To the delight of most shareholders, Hemisphere Energy has now broken into profitability. And since the stock has fallen 15% over the last five years, there might be an opportunity here. So researching this company further and determining whether or not these trends will continue seems justified.
On a separate note, we've found 1 warning sign for Hemisphere Energy you'll probably want to know about.
If you want to search for solid companies with great earnings, check out this free list of companies with good balance sheets and impressive returns on equity.
This article by Simply Wall St is general in nature. It does not constitute a recommendation to buy or sell any stock, and does not take account of your objectives, or your financial situation. We aim to bring you long-term focused analysis driven by fundamental data. Note that our analysis may not factor in the latest price-sensitive company announcements or qualitative material. Simply Wall St has no position in any stocks mentioned.
Have feedback on this article? Concerned about the content? Get in touch with us directly. Alternatively, email editorial-team@simplywallst.com.
