
 Yahoo Finance
 We Like These Underlying Return On Capital Trends At Steinhoff International Holdings (JSE:SNH)
If we want to find a stock that could multiply over the long term, what are the underlying trends we should look for? In a perfect world, we'd like to see a company investing more capital into its business and ideally the returns earned from that capital are also increasing. If you see this, it typically means it's a company with a great business model and plenty of profitable reinvestment opportunities. So when we looked at Steinhoff International Holdings (JSE:SNH) and its trend of ROCE, we really liked what we saw.
Return On Capital Employed (ROCE): What Is It?
Just to clarify if you're unsure, ROCE is a metric for evaluating how much pre-tax income (in percentage terms) a company earns on the capital invested in its business. To calculate this metric for Steinhoff International Holdings, this is the formula:
Return on Capital Employed = Earnings Before Interest and Tax (EBIT) ÷ (Total Assets - Current Liabilities)
0.067 = €680m ÷ (€14b - €4.0b) (Based on the trailing twelve months to March 2022).
So, Steinhoff International Holdings has an ROCE of 6.7%. On its own, that's a low figure but it's around the 7.6% average generated by the Multiline Retail industry.
See our latest analysis for Steinhoff International Holdings
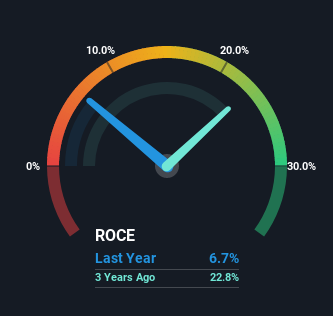
Historical performance is a great place to start when researching a stock so above you can see the gauge for Steinhoff International Holdings' ROCE against it's prior returns. If you're interested in investigating Steinhoff International Holdings' past further, check out this free graph of past earnings, revenue and cash flow.
How Are Returns Trending?
You'd find it hard not to be impressed with the ROCE trend at Steinhoff International Holdings. The figures show that over the last five years, returns on capital have grown by 209%. That's not bad because this tells for every dollar invested (capital employed), the company is increasing the amount earned from that dollar. Speaking of capital employed, the company is actually utilizing 64% less than it was five years ago, which can be indicative of a business that's improving its efficiency. Steinhoff International Holdings may be selling some assets so it's worth investigating if the business has plans for future investments to increase returns further still.
On a side note, we noticed that the improvement in ROCE appears to be partly fueled by an increase in current liabilities. The current liabilities has increased to 28% of total assets, so the business is now more funded by the likes of its suppliers or short-term creditors. It's worth keeping an eye on this because as the percentage of current liabilities to total assets increases, some aspects of risk also increase.
What We Can Learn From Steinhoff International Holdings' ROCE
In summary, it's great to see that Steinhoff International Holdings has been able to turn things around and earn higher returns on lower amounts of capital. However the stock is down a substantial 97% in the last five years so there could be other areas of the business hurting its prospects. Regardless, we think the underlying fundamentals warrant this stock for further investigation.
One more thing to note, we've identified 1 warning sign with Steinhoff International Holdings and understanding this should be part of your investment process.
For those who like to invest in solid companies, check out this free list of companies with solid balance sheets and high returns on equity.
Have feedback on this article? Concerned about the content? Get in touch with us directly. Alternatively, email editorial-team (at) simplywallst.com.
This article by Simply Wall St is general in nature. We provide commentary based on historical data and analyst forecasts only using an unbiased methodology and our articles are not intended to be financial advice. It does not constitute a recommendation to buy or sell any stock, and does not take account of your objectives, or your financial situation. We aim to bring you long-term focused analysis driven by fundamental data. Note that our analysis may not factor in the latest price-sensitive company announcements or qualitative material. Simply Wall St has no position in any stocks mentioned.
Join A Paid User Research Session
You’ll receive a US$30 Amazon Gift card for 1 hour of your time while helping us build better investing tools for the individual investors like yourself. Sign up here
