
 Yahoo Finance
 We Like These Underlying Return On Capital Trends At SFL (NYSE:SFL)
If you're not sure where to start when looking for the next multi-bagger, there are a few key trends you should keep an eye out for. Firstly, we'll want to see a proven return on capital employed (ROCE) that is increasing, and secondly, an expanding base of capital employed. This shows us that it's a compounding machine, able to continually reinvest its earnings back into the business and generate higher returns. Speaking of which, we noticed some great changes in SFL's (NYSE:SFL) returns on capital, so let's have a look.
Return On Capital Employed (ROCE): What Is It?
Just to clarify if you're unsure, ROCE is a metric for evaluating how much pre-tax income (in percentage terms) a company earns on the capital invested in its business. To calculate this metric for SFL, this is the formula:
Return on Capital Employed = Earnings Before Interest and Tax (EBIT) ÷ (Total Assets - Current Liabilities)
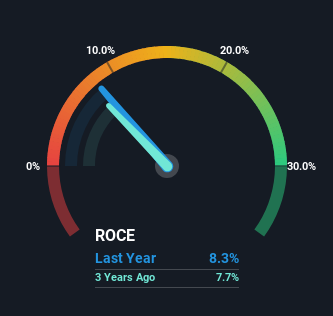
0.083 = US$229m ÷ (US$3.7b - US$969m) (Based on the trailing twelve months to December 2023).
So, SFL has an ROCE of 8.3%. In absolute terms, that's a low return and it also under-performs the Oil and Gas industry average of 15%.
Check out our latest analysis for SFL
In the above chart we have measured SFL's prior ROCE against its prior performance, but the future is arguably more important. If you'd like, you can check out the forecasts from the analysts covering SFL for free.
How Are Returns Trending?
You'd find it hard not to be impressed with the ROCE trend at SFL. The data shows that returns on capital have increased by 63% over the trailing five years. The company is now earning US$0.08 per dollar of capital employed. In regards to capital employed, SFL appears to been achieving more with less, since the business is using 20% less capital to run its operation. A business that's shrinking its asset base like this isn't usually typical of a soon to be multi-bagger company.
On a side note, we noticed that the improvement in ROCE appears to be partly fueled by an increase in current liabilities. Essentially the business now has suppliers or short-term creditors funding about 26% of its operations, which isn't ideal. It's worth keeping an eye on this because as the percentage of current liabilities to total assets increases, some aspects of risk also increase.
The Key Takeaway
In a nutshell, we're pleased to see that SFL has been able to generate higher returns from less capital. And with a respectable 56% awarded to those who held the stock over the last five years, you could argue that these developments are starting to get the attention they deserve. With that being said, we still think the promising fundamentals mean the company deserves some further due diligence.
On a final note, we found 3 warning signs for SFL (2 are concerning) you should be aware of.
For those who like to invest in solid companies, check out this free list of companies with solid balance sheets and high returns on equity.
Have feedback on this article? Concerned about the content? Get in touch with us directly. Alternatively, email editorial-team (at) simplywallst.com.
This article by Simply Wall St is general in nature. We provide commentary based on historical data and analyst forecasts only using an unbiased methodology and our articles are not intended to be financial advice. It does not constitute a recommendation to buy or sell any stock, and does not take account of your objectives, or your financial situation. We aim to bring you long-term focused analysis driven by fundamental data. Note that our analysis may not factor in the latest price-sensitive company announcements or qualitative material. Simply Wall St has no position in any stocks mentioned.
