
 Yahoo Finance
 We Like These Underlying Return On Capital Trends At Rolls-Royce Holdings (LON:RR.)
If we want to find a stock that could multiply over the long term, what are the underlying trends we should look for? Ideally, a business will show two trends; firstly a growing return on capital employed (ROCE) and secondly, an increasing amount of capital employed. Basically this means that a company has profitable initiatives that it can continue to reinvest in, which is a trait of a compounding machine. So on that note, Rolls-Royce Holdings (LON:RR.) looks quite promising in regards to its trends of return on capital.
Understanding Return On Capital Employed (ROCE)
If you haven't worked with ROCE before, it measures the 'return' (pre-tax profit) a company generates from capital employed in its business. The formula for this calculation on Rolls-Royce Holdings is:
Return on Capital Employed = Earnings Before Interest and Tax (EBIT) ÷ (Total Assets - Current Liabilities)
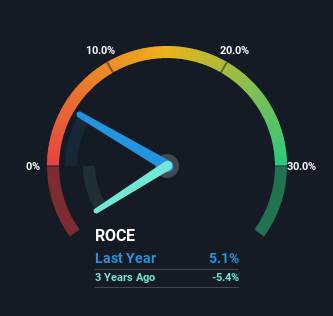
0.051 = UK£787m ÷ (UK£29b - UK£14b) (Based on the trailing twelve months to December 2022).
Therefore, Rolls-Royce Holdings has an ROCE of 5.1%. Ultimately, that's a low return and it under-performs the Aerospace & Defense industry average of 10%.
Check out our latest analysis for Rolls-Royce Holdings
Above you can see how the current ROCE for Rolls-Royce Holdings compares to its prior returns on capital, but there's only so much you can tell from the past. If you'd like to see what analysts are forecasting going forward, you should check out our free report for Rolls-Royce Holdings.
What The Trend Of ROCE Can Tell Us
Rolls-Royce Holdings' ROCE growth is quite impressive. The figures show that over the last five years, ROCE has grown 70% whilst employing roughly the same amount of capital. Basically the business is generating higher returns from the same amount of capital and that is proof that there are improvements in the company's efficiencies. The company is doing well in that sense, and it's worth investigating what the management team has planned for long term growth prospects.
On a side note, Rolls-Royce Holdings' current liabilities are still rather high at 47% of total assets. This can bring about some risks because the company is basically operating with a rather large reliance on its suppliers or other sorts of short-term creditors. Ideally we'd like to see this reduce as that would mean fewer obligations bearing risks.
In Conclusion...
To sum it up, Rolls-Royce Holdings is collecting higher returns from the same amount of capital, and that's impressive. Given the stock has declined 48% in the last five years, this could be a good investment if the valuation and other metrics are also appealing. So researching this company further and determining whether or not these trends will continue seems justified.
If you want to know some of the risks facing Rolls-Royce Holdings we've found 2 warning signs (1 is significant!) that you should be aware of before investing here.
While Rolls-Royce Holdings isn't earning the highest return, check out this free list of companies that are earning high returns on equity with solid balance sheets.
Have feedback on this article? Concerned about the content? Get in touch with us directly. Alternatively, email editorial-team (at) simplywallst.com.
This article by Simply Wall St is general in nature. We provide commentary based on historical data and analyst forecasts only using an unbiased methodology and our articles are not intended to be financial advice. It does not constitute a recommendation to buy or sell any stock, and does not take account of your objectives, or your financial situation. We aim to bring you long-term focused analysis driven by fundamental data. Note that our analysis may not factor in the latest price-sensitive company announcements or qualitative material. Simply Wall St has no position in any stocks mentioned.
Join A Paid User Research Session
You’ll receive a US$30 Amazon Gift card for 1 hour of your time while helping us build better investing tools for the individual investors like yourself. Sign up here
