
 Yahoo Finance
 We Like These Underlying Return On Capital Trends At MDA (TSE:MDA)
To find a multi-bagger stock, what are the underlying trends we should look for in a business? One common approach is to try and find a company with returns on capital employed (ROCE) that are increasing, in conjunction with a growing amount of capital employed. This shows us that it's a compounding machine, able to continually reinvest its earnings back into the business and generate higher returns. Speaking of which, we noticed some great changes in MDA's (TSE:MDA) returns on capital, so let's have a look.
What Is Return On Capital Employed (ROCE)?
If you haven't worked with ROCE before, it measures the 'return' (pre-tax profit) a company generates from capital employed in its business. Analysts use this formula to calculate it for MDA:
Return on Capital Employed = Earnings Before Interest and Tax (EBIT) ÷ (Total Assets - Current Liabilities)
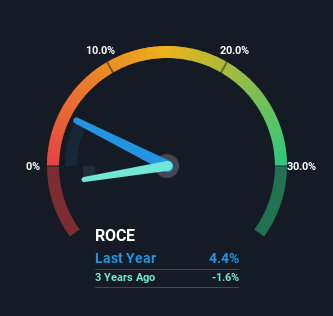
0.044 = CA$79m ÷ (CA$2.2b - CA$373m) (Based on the trailing twelve months to December 2023).
Thus, MDA has an ROCE of 4.4%. Ultimately, that's a low return and it under-performs the Aerospace & Defense industry average of 9.5%.
Check out our latest analysis for MDA
Above you can see how the current ROCE for MDA compares to its prior returns on capital, but there's only so much you can tell from the past. If you're interested, you can view the analysts predictions in our free analyst report for MDA .
What Can We Tell From MDA's ROCE Trend?
We're delighted to see that MDA is reaping rewards from its investments and is now generating some pre-tax profits. Shareholders would no doubt be pleased with this because the business was loss-making three years ago but is is now generating 4.4% on its capital. And unsurprisingly, like most companies trying to break into the black, MDA is utilizing 47% more capital than it was three years ago. We like this trend, because it tells us the company has profitable reinvestment opportunities available to it, and if it continues going forward that can lead to a multi-bagger performance.
The Key Takeaway
Long story short, we're delighted to see that MDA's reinvestment activities have paid off and the company is now profitable. And with a respectable 99% awarded to those who held the stock over the last year, you could argue that these developments are starting to get the attention they deserve. With that being said, we still think the promising fundamentals mean the company deserves some further due diligence.
On the other side of ROCE, we have to consider valuation. That's why we have a FREE intrinsic value estimation for MDA on our platform that is definitely worth checking out.
If you want to search for solid companies with great earnings, check out this free list of companies with good balance sheets and impressive returns on equity.
Have feedback on this article? Concerned about the content? Get in touch with us directly. Alternatively, email editorial-team (at) simplywallst.com.
This article by Simply Wall St is general in nature. We provide commentary based on historical data and analyst forecasts only using an unbiased methodology and our articles are not intended to be financial advice. It does not constitute a recommendation to buy or sell any stock, and does not take account of your objectives, or your financial situation. We aim to bring you long-term focused analysis driven by fundamental data. Note that our analysis may not factor in the latest price-sensitive company announcements or qualitative material. Simply Wall St has no position in any stocks mentioned.
