
 Yahoo Finance
 We Like These Underlying Return On Capital Trends At International Game Technology (NYSE:IGT)
Did you know there are some financial metrics that can provide clues of a potential multi-bagger? Ideally, a business will show two trends; firstly a growing return on capital employed (ROCE) and secondly, an increasing amount of capital employed. Ultimately, this demonstrates that it's a business that is reinvesting profits at increasing rates of return. With that in mind, we've noticed some promising trends at International Game Technology (NYSE:IGT) so let's look a bit deeper.
Return On Capital Employed (ROCE): What Is It?
If you haven't worked with ROCE before, it measures the 'return' (pre-tax profit) a company generates from capital employed in its business. To calculate this metric for International Game Technology, this is the formula:
Return on Capital Employed = Earnings Before Interest and Tax (EBIT) ÷ (Total Assets - Current Liabilities)
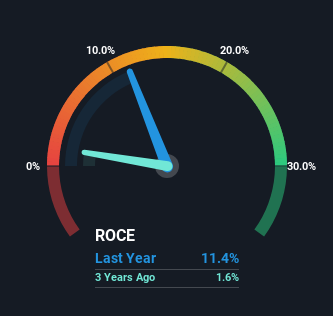
0.11 = US$981m ÷ (US$10b - US$1.9b) (Based on the trailing twelve months to September 2023).
Therefore, International Game Technology has an ROCE of 11%. On its own, that's a standard return, however it's much better than the 9.1% generated by the Hospitality industry.
View our latest analysis for International Game Technology
Above you can see how the current ROCE for International Game Technology compares to its prior returns on capital, but there's only so much you can tell from the past. If you'd like to see what analysts are forecasting going forward, you should check out our free report for International Game Technology.
The Trend Of ROCE
International Game Technology has not disappointed in regards to ROCE growth. The data shows that returns on capital have increased by 63% over the trailing five years. That's a very favorable trend because this means that the company is earning more per dollar of capital that's being employed. Speaking of capital employed, the company is actually utilizing 26% less than it was five years ago, which can be indicative of a business that's improving its efficiency. If this trend continues, the business might be getting more efficient but it's shrinking in terms of total assets.
Our Take On International Game Technology's ROCE
From what we've seen above, International Game Technology has managed to increase it's returns on capital all the while reducing it's capital base. And with a respectable 87% awarded to those who held the stock over the last five years, you could argue that these developments are starting to get the attention they deserve. In light of that, we think it's worth looking further into this stock because if International Game Technology can keep these trends up, it could have a bright future ahead.
One more thing: We've identified 3 warning signs with International Game Technology (at least 1 which doesn't sit too well with us) , and understanding these would certainly be useful.
While International Game Technology isn't earning the highest return, check out this free list of companies that are earning high returns on equity with solid balance sheets.
Have feedback on this article? Concerned about the content? Get in touch with us directly. Alternatively, email editorial-team (at) simplywallst.com.
This article by Simply Wall St is general in nature. We provide commentary based on historical data and analyst forecasts only using an unbiased methodology and our articles are not intended to be financial advice. It does not constitute a recommendation to buy or sell any stock, and does not take account of your objectives, or your financial situation. We aim to bring you long-term focused analysis driven by fundamental data. Note that our analysis may not factor in the latest price-sensitive company announcements or qualitative material. Simply Wall St has no position in any stocks mentioned.
