
 Yahoo Finance
 We Like These Underlying Return On Capital Trends At Haynes International (NASDAQ:HAYN)
If you're not sure where to start when looking for the next multi-bagger, there are a few key trends you should keep an eye out for. One common approach is to try and find a company with returns on capital employed (ROCE) that are increasing, in conjunction with a growing amount of capital employed. If you see this, it typically means it's a company with a great business model and plenty of profitable reinvestment opportunities. So on that note, Haynes International (NASDAQ:HAYN) looks quite promising in regards to its trends of return on capital.
Return On Capital Employed (ROCE): What Is It?
Just to clarify if you're unsure, ROCE is a metric for evaluating how much pre-tax income (in percentage terms) a company earns on the capital invested in its business. To calculate this metric for Haynes International, this is the formula:
Return on Capital Employed = Earnings Before Interest and Tax (EBIT) ÷ (Total Assets - Current Liabilities)
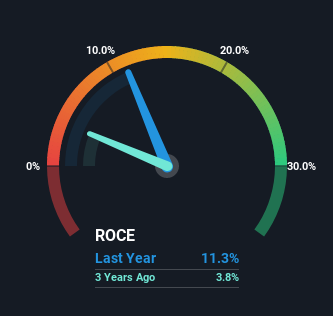
0.11 = US$65m ÷ (US$666m - US$89m) (Based on the trailing twelve months to December 2022).
So, Haynes International has an ROCE of 11%. In absolute terms, that's a pretty standard return but compared to the Metals and Mining industry average it falls behind.
See our latest analysis for Haynes International
In the above chart we have measured Haynes International's prior ROCE against its prior performance, but the future is arguably more important. If you'd like to see what analysts are forecasting going forward, you should check out our free report for Haynes International.
How Are Returns Trending?
We're delighted to see that Haynes International is reaping rewards from its investments and has now broken into profitability. While the business was unprofitable in the past, it's now turned things around and is earning 11% on its capital. While returns have increased, the amount of capital employed by Haynes International has remained flat over the period. That being said, while an increase in efficiency is no doubt appealing, it'd be helpful to know if the company does have any investment plans going forward. Because in the end, a business can only get so efficient.
The Key Takeaway
In summary, we're delighted to see that Haynes International has been able to increase efficiencies and earn higher rates of return on the same amount of capital. And investors seem to expect more of this going forward, since the stock has rewarded shareholders with a 52% return over the last five years. So given the stock has proven it has promising trends, it's worth researching the company further to see if these trends are likely to persist.
Haynes International does come with some risks though, we found 2 warning signs in our investment analysis, and 1 of those is significant...
While Haynes International may not currently earn the highest returns, we've compiled a list of companies that currently earn more than 25% return on equity. Check out this free list here.
Have feedback on this article? Concerned about the content? Get in touch with us directly. Alternatively, email editorial-team (at) simplywallst.com.
This article by Simply Wall St is general in nature. We provide commentary based on historical data and analyst forecasts only using an unbiased methodology and our articles are not intended to be financial advice. It does not constitute a recommendation to buy or sell any stock, and does not take account of your objectives, or your financial situation. We aim to bring you long-term focused analysis driven by fundamental data. Note that our analysis may not factor in the latest price-sensitive company announcements or qualitative material. Simply Wall St has no position in any stocks mentioned.
Join A Paid User Research Session
You’ll receive a US$30 Amazon Gift card for 1 hour of your time while helping us build better investing tools for the individual investors like yourself. Sign up here
