
 Yahoo Finance
 We Like These Underlying Return On Capital Trends At CEMATRIX (CVE:CVX)
To find a multi-bagger stock, what are the underlying trends we should look for in a business? Firstly, we'll want to see a proven return on capital employed (ROCE) that is increasing, and secondly, an expanding base of capital employed. If you see this, it typically means it's a company with a great business model and plenty of profitable reinvestment opportunities. So when we looked at CEMATRIX (CVE:CVX) and its trend of ROCE, we really liked what we saw.
Return On Capital Employed (ROCE): What Is It?
For those who don't know, ROCE is a measure of a company's yearly pre-tax profit (its return), relative to the capital employed in the business. To calculate this metric for CEMATRIX, this is the formula:
Return on Capital Employed = Earnings Before Interest and Tax (EBIT) ÷ (Total Assets - Current Liabilities)
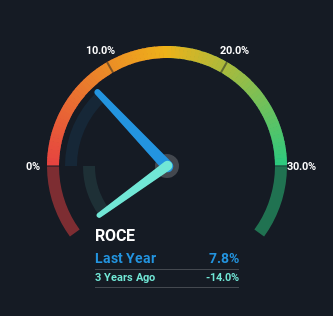
0.078 = CA$2.4m ÷ (CA$39m - CA$8.3m) (Based on the trailing twelve months to December 2023).
Therefore, CEMATRIX has an ROCE of 7.8%. Ultimately, that's a low return and it under-performs the Basic Materials industry average of 12%.
Check out our latest analysis for CEMATRIX
In the above chart we have measured CEMATRIX's prior ROCE against its prior performance, but the future is arguably more important. If you'd like to see what analysts are forecasting going forward, you should check out our free analyst report for CEMATRIX .
The Trend Of ROCE
Even though ROCE is still low in absolute terms, it's good to see it's heading in the right direction. The numbers show that in the last five years, the returns generated on capital employed have grown considerably to 7.8%. Basically the business is earning more per dollar of capital invested and in addition to that, 125% more capital is being employed now too. So we're very much inspired by what we're seeing at CEMATRIX thanks to its ability to profitably reinvest capital.
One more thing to note, CEMATRIX has decreased current liabilities to 21% of total assets over this period, which effectively reduces the amount of funding from suppliers or short-term creditors. This tells us that CEMATRIX has grown its returns without a reliance on increasing their current liabilities, which we're very happy with.
What We Can Learn From CEMATRIX's ROCE
In summary, it's great to see that CEMATRIX can compound returns by consistently reinvesting capital at increasing rates of return, because these are some of the key ingredients of those highly sought after multi-baggers. And investors seem to expect more of this going forward, since the stock has rewarded shareholders with a 81% return over the last five years. Therefore, we think it would be worth your time to check if these trends are going to continue.
If you'd like to know about the risks facing CEMATRIX, we've discovered 1 warning sign that you should be aware of.
While CEMATRIX isn't earning the highest return, check out this free list of companies that are earning high returns on equity with solid balance sheets.
Have feedback on this article? Concerned about the content? Get in touch with us directly. Alternatively, email editorial-team (at) simplywallst.com.
This article by Simply Wall St is general in nature. We provide commentary based on historical data and analyst forecasts only using an unbiased methodology and our articles are not intended to be financial advice. It does not constitute a recommendation to buy or sell any stock, and does not take account of your objectives, or your financial situation. We aim to bring you long-term focused analysis driven by fundamental data. Note that our analysis may not factor in the latest price-sensitive company announcements or qualitative material. Simply Wall St has no position in any stocks mentioned.
