
 Yahoo Finance
 Under The Bonnet, Yellow Cake's (LON:YCA) Returns Look Impressive
What are the early trends we should look for to identify a stock that could multiply in value over the long term? Firstly, we'd want to identify a growing return on capital employed (ROCE) and then alongside that, an ever-increasing base of capital employed. Put simply, these types of businesses are compounding machines, meaning they are continually reinvesting their earnings at ever-higher rates of return. So when we looked at the ROCE trend of Yellow Cake (LON:YCA) we really liked what we saw.
Understanding Return On Capital Employed (ROCE)
For those that aren't sure what ROCE is, it measures the amount of pre-tax profits a company can generate from the capital employed in its business. The formula for this calculation on Yellow Cake is:
Return on Capital Employed = Earnings Before Interest and Tax (EBIT) ÷ (Total Assets - Current Liabilities)
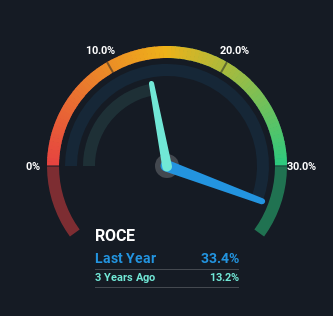
0.33 = US$499m ÷ (US$1.6b - US$71m) (Based on the trailing twelve months to September 2023).
So, Yellow Cake has an ROCE of 33%. That's a fantastic return and not only that, it outpaces the average of 15% earned by companies in a similar industry.
View our latest analysis for Yellow Cake
Above you can see how the current ROCE for Yellow Cake compares to its prior returns on capital, but there's only so much you can tell from the past. If you'd like to see what analysts are forecasting going forward, you should check out our free analyst report for Yellow Cake .
What Can We Tell From Yellow Cake's ROCE Trend?
We're delighted to see that Yellow Cake is reaping rewards from its investments and is now generating some pre-tax profits. About four years ago the company was generating losses but things have turned around because it's now earning 33% on its capital. Not only that, but the company is utilizing 486% more capital than before, but that's to be expected from a company trying to break into profitability. We like this trend, because it tells us the company has profitable reinvestment opportunities available to it, and if it continues going forward that can lead to a multi-bagger performance.
The Key Takeaway
To the delight of most shareholders, Yellow Cake has now broken into profitability. Since the stock has returned a staggering 179% to shareholders over the last five years, it looks like investors are recognizing these changes. So given the stock has proven it has promising trends, it's worth researching the company further to see if these trends are likely to persist.
Yellow Cake does come with some risks though, we found 4 warning signs in our investment analysis, and 2 of those are concerning...
If you want to search for more stocks that have been earning high returns, check out this free list of stocks with solid balance sheets that are also earning high returns on equity.
Have feedback on this article? Concerned about the content? Get in touch with us directly. Alternatively, email editorial-team (at) simplywallst.com.
This article by Simply Wall St is general in nature. We provide commentary based on historical data and analyst forecasts only using an unbiased methodology and our articles are not intended to be financial advice. It does not constitute a recommendation to buy or sell any stock, and does not take account of your objectives, or your financial situation. We aim to bring you long-term focused analysis driven by fundamental data. Note that our analysis may not factor in the latest price-sensitive company announcements or qualitative material. Simply Wall St has no position in any stocks mentioned.
Have feedback on this article? Concerned about the content? Get in touch with us directly. Alternatively, email editorial-team@simplywallst.com
