
 Yahoo Finance
 Under The Bonnet, Robex Resources' (CVE:RBX) Returns Look Impressive
Finding a business that has the potential to grow substantially is not easy, but it is possible if we look at a few key financial metrics. In a perfect world, we'd like to see a company investing more capital into its business and ideally the returns earned from that capital are also increasing. If you see this, it typically means it's a company with a great business model and plenty of profitable reinvestment opportunities. So when we looked at the ROCE trend of Robex Resources (CVE:RBX) we really liked what we saw.
Understanding Return On Capital Employed (ROCE)
Just to clarify if you're unsure, ROCE is a metric for evaluating how much pre-tax income (in percentage terms) a company earns on the capital invested in its business. To calculate this metric for Robex Resources, this is the formula:
Return on Capital Employed = Earnings Before Interest and Tax (EBIT) ÷ (Total Assets - Current Liabilities)
0.39 = CA$50m ÷ (CA$153m - CA$22m) (Based on the trailing twelve months to September 2022).
Therefore, Robex Resources has an ROCE of 39%. That's a fantastic return and not only that, it outpaces the average of 1.5% earned by companies in a similar industry.
View our latest analysis for Robex Resources
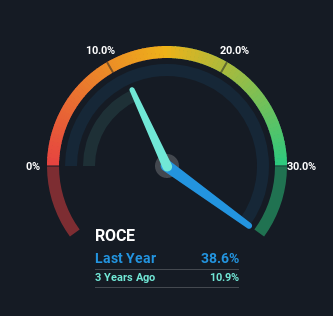
Historical performance is a great place to start when researching a stock so above you can see the gauge for Robex Resources' ROCE against it's prior returns. If you'd like to look at how Robex Resources has performed in the past in other metrics, you can view this free graph of past earnings, revenue and cash flow.
What Can We Tell From Robex Resources' ROCE Trend?
Investors would be pleased with what's happening at Robex Resources. The numbers show that in the last five years, the returns generated on capital employed have grown considerably to 39%. The company is effectively making more money per dollar of capital used, and it's worth noting that the amount of capital has increased too, by 87%. The increasing returns on a growing amount of capital is common amongst multi-baggers and that's why we're impressed.
One more thing to note, Robex Resources has decreased current liabilities to 15% of total assets over this period, which effectively reduces the amount of funding from suppliers or short-term creditors. Therefore we can rest assured that the growth in ROCE is a result of the business' fundamental improvements, rather than a cooking class featuring this company's books.
What We Can Learn From Robex Resources' ROCE
In summary, it's great to see that Robex Resources can compound returns by consistently reinvesting capital at increasing rates of return, because these are some of the key ingredients of those highly sought after multi-baggers. And a remarkable 257% total return over the last five years tells us that investors are expecting more good things to come in the future. In light of that, we think it's worth looking further into this stock because if Robex Resources can keep these trends up, it could have a bright future ahead.
If you want to continue researching Robex Resources, you might be interested to know about the 2 warning signs that our analysis has discovered.
If you'd like to see other companies earning high returns, check out our free list of companies earning high returns with solid balance sheets here.
Have feedback on this article? Concerned about the content? Get in touch with us directly. Alternatively, email editorial-team (at) simplywallst.com.
This article by Simply Wall St is general in nature. We provide commentary based on historical data and analyst forecasts only using an unbiased methodology and our articles are not intended to be financial advice. It does not constitute a recommendation to buy or sell any stock, and does not take account of your objectives, or your financial situation. We aim to bring you long-term focused analysis driven by fundamental data. Note that our analysis may not factor in the latest price-sensitive company announcements or qualitative material. Simply Wall St has no position in any stocks mentioned.
Join A Paid User Research Session
You’ll receive a US$30 Amazon Gift card for 1 hour of your time while helping us build better investing tools for the individual investors like yourself. Sign up here
