
 Yahoo Finance
 Under The Bonnet, Goodfellow's (TSE:GDL) Returns Look Impressive
What trends should we look for it we want to identify stocks that can multiply in value over the long term? Ideally, a business will show two trends; firstly a growing return on capital employed (ROCE) and secondly, an increasing amount of capital employed. Put simply, these types of businesses are compounding machines, meaning they are continually reinvesting their earnings at ever-higher rates of return. With that in mind, the ROCE of Goodfellow (TSE:GDL) looks great, so lets see what the trend can tell us.
Understanding Return On Capital Employed (ROCE)
For those that aren't sure what ROCE is, it measures the amount of pre-tax profits a company can generate from the capital employed in its business. Analysts use this formula to calculate it for Goodfellow:
Return on Capital Employed = Earnings Before Interest and Tax (EBIT) ÷ (Total Assets - Current Liabilities)
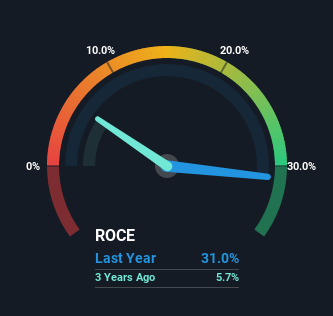
0.31 = CA$55m ÷ (CA$276m - CA$98m) (Based on the trailing twelve months to February 2022).
So, Goodfellow has an ROCE of 31%. That's a fantastic return and not only that, it outpaces the average of 24% earned by companies in a similar industry.
Check out our latest analysis for Goodfellow
While the past is not representative of the future, it can be helpful to know how a company has performed historically, which is why we have this chart above. If you'd like to look at how Goodfellow has performed in the past in other metrics, you can view this free graph of past earnings, revenue and cash flow.
The Trend Of ROCE
The fact that Goodfellow is now generating some pre-tax profits from its prior investments is very encouraging. About five years ago the company was generating losses but things have turned around because it's now earning 31% on its capital. Not only that, but the company is utilizing 61% more capital than before, but that's to be expected from a company trying to break into profitability. This can tell us that the company has plenty of reinvestment opportunities that are able to generate higher returns.
One more thing to note, Goodfellow has decreased current liabilities to 36% of total assets over this period, which effectively reduces the amount of funding from suppliers or short-term creditors. This tells us that Goodfellow has grown its returns without a reliance on increasing their current liabilities, which we're very happy with.
The Key Takeaway
Overall, Goodfellow gets a big tick from us thanks in most part to the fact that it is now profitable and is reinvesting in its business. Since the stock has returned a solid 72% to shareholders over the last five years, it's fair to say investors are beginning to recognize these changes. With that being said, we still think the promising fundamentals mean the company deserves some further due diligence.
Goodfellow does come with some risks though, we found 4 warning signs in our investment analysis, and 1 of those doesn't sit too well with us...
High returns are a key ingredient to strong performance, so check out our free list ofstocks earning high returns on equity with solid balance sheets.
Have feedback on this article? Concerned about the content? Get in touch with us directly. Alternatively, email editorial-team (at) simplywallst.com.
This article by Simply Wall St is general in nature. We provide commentary based on historical data and analyst forecasts only using an unbiased methodology and our articles are not intended to be financial advice. It does not constitute a recommendation to buy or sell any stock, and does not take account of your objectives, or your financial situation. We aim to bring you long-term focused analysis driven by fundamental data. Note that our analysis may not factor in the latest price-sensitive company announcements or qualitative material. Simply Wall St has no position in any stocks mentioned.
