
 Yahoo Finance
 Ultra Clean Holdings (NASDAQ:UCTT) shareholders are still up 113% over 3 years despite pulling back 9.9% in the past week
Ultra Clean Holdings, Inc. (NASDAQ:UCTT) shareholders might be concerned after seeing the share price drop 19% in the last month. But that doesn't undermine the rather lovely longer-term return, if you measure over the last three years. In three years the stock price has launched 113% higher: a great result. It's not uncommon to see a share price retrace a bit, after a big gain. Only time will tell if there is still too much optimism currently reflected in the share price.
While the stock has fallen 9.9% this week, it's worth focusing on the longer term and seeing if the stocks historical returns have been driven by the underlying fundamentals.
See our latest analysis for Ultra Clean Holdings
To paraphrase Benjamin Graham: Over the short term the market is a voting machine, but over the long term it's a weighing machine. One flawed but reasonable way to assess how sentiment around a company has changed is to compare the earnings per share (EPS) with the share price.
Ultra Clean Holdings became profitable within the last three years. Given the importance of this milestone, it's not overly surprising that the share price has increased strongly.
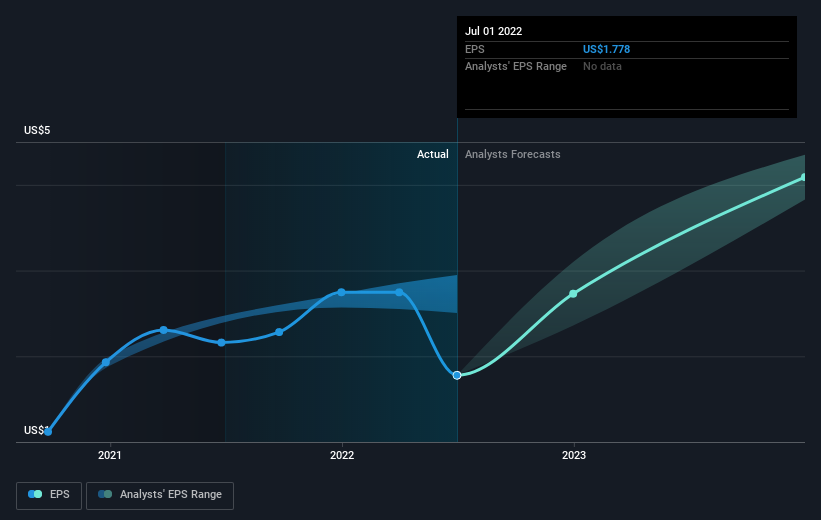
You can see how EPS has changed over time in the image below (click on the chart to see the exact values).
We know that Ultra Clean Holdings has improved its bottom line over the last three years, but what does the future have in store? This free interactive report on Ultra Clean Holdings' balance sheet strength is a great place to start, if you want to investigate the stock further.
A Different Perspective
We regret to report that Ultra Clean Holdings shareholders are down 40% for the year. Unfortunately, that's worse than the broader market decline of 18%. Having said that, it's inevitable that some stocks will be oversold in a falling market. The key is to keep your eyes on the fundamental developments. Longer term investors wouldn't be so upset, since they would have made 5%, each year, over five years. It could be that the recent sell-off is an opportunity, so it may be worth checking the fundamental data for signs of a long term growth trend. It's always interesting to track share price performance over the longer term. But to understand Ultra Clean Holdings better, we need to consider many other factors. Even so, be aware that Ultra Clean Holdings is showing 3 warning signs in our investment analysis , you should know about...
But note: Ultra Clean Holdings may not be the best stock to buy. So take a peek at this free list of interesting companies with past earnings growth (and further growth forecast).
Please note, the market returns quoted in this article reflect the market weighted average returns of stocks that currently trade on US exchanges.
Have feedback on this article? Concerned about the content? Get in touch with us directly. Alternatively, email editorial-team (at) simplywallst.com.
This article by Simply Wall St is general in nature. We provide commentary based on historical data and analyst forecasts only using an unbiased methodology and our articles are not intended to be financial advice. It does not constitute a recommendation to buy or sell any stock, and does not take account of your objectives, or your financial situation. We aim to bring you long-term focused analysis driven by fundamental data. Note that our analysis may not factor in the latest price-sensitive company announcements or qualitative material. Simply Wall St has no position in any stocks mentioned.
Join A Paid User Research Session
You’ll receive a US$30 Amazon Gift card for 1 hour of your time while helping us build better investing tools for the individual investors like yourself. Sign up here
