
 Yahoo Finance
 UGE International Ltd.'s (CVE:UGE) Path To Profitability
UGE International Ltd. (CVE:UGE) is possibly approaching a major achievement in its business, so we would like to shine some light on the company. UGE International Ltd. develops, builds, finances, owns, and operates commercial and community solar facilities in Canada, the United States, and the Philippines. The CA$27m market-cap company posted a loss in its most recent financial year of US$7.4m and a latest trailing-twelve-month loss of US$13m leading to an even wider gap between loss and breakeven. Many investors are wondering about the rate at which UGE International will turn a profit, with the big question being “when will the company breakeven?” In this article, we will touch on the expectations for the company's growth and when analysts expect it to become profitable.
See our latest analysis for UGE International
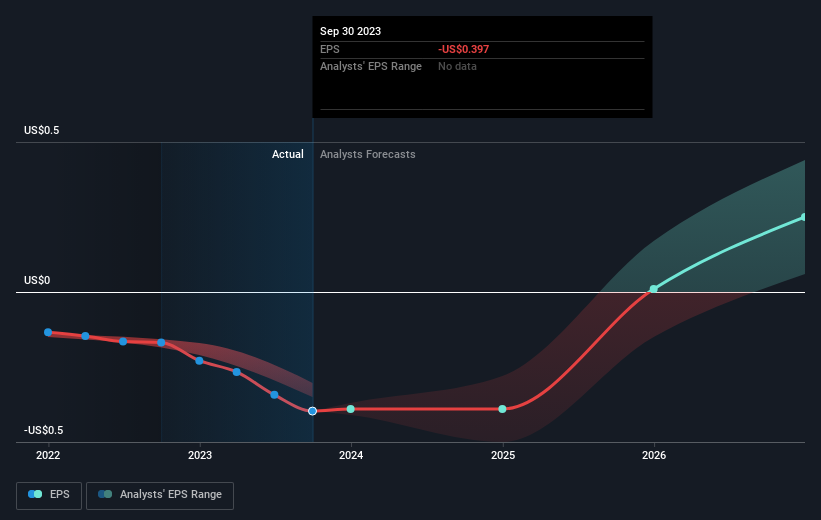
UGE International is bordering on breakeven, according to the 3 Canadian Construction analysts. They anticipate the company to incur a final loss in 2024, before generating positive profits of US$393k in 2025. So, the company is predicted to breakeven just over a year from today. What rate will the company have to grow year-on-year in order to breakeven on this date? Using a line of best fit, we calculated an average annual growth rate of 58%, which signals high confidence from analysts. If this rate turns out to be too aggressive, the company may become profitable much later than analysts predict.
We're not going to go through company-specific developments for UGE International given that this is a high-level summary, but, keep in mind that by and large a high forecast growth rate is not unusual for a company that is currently undergoing an investment period.
One thing we would like to bring into light with UGE International is it currently has negative equity on its balance sheet. This can sometimes arise from accounting methods used to deal with accumulated losses from prior years, which are viewed as liabilities carried forward until it cancels out in the future. Oftentimes, losses exist only on paper but other times, it can be a red flag.
Next Steps:
There are too many aspects of UGE International to cover in one brief article, but the key fundamentals for the company can all be found in one place – UGE International's company page on Simply Wall St. We've also compiled a list of relevant factors you should look at:
Valuation: What is UGE International worth today? Has the future growth potential already been factored into the price? The intrinsic value infographic in our free research report helps visualize whether UGE International is currently mispriced by the market.
Management Team: An experienced management team on the helm increases our confidence in the business – take a look at who sits on UGE International’s board and the CEO’s background.
Other High-Performing Stocks: Are there other stocks that provide better prospects with proven track records? Explore our free list of these great stocks here.
Have feedback on this article? Concerned about the content? Get in touch with us directly. Alternatively, email editorial-team (at) simplywallst.com.
This article by Simply Wall St is general in nature. We provide commentary based on historical data and analyst forecasts only using an unbiased methodology and our articles are not intended to be financial advice. It does not constitute a recommendation to buy or sell any stock, and does not take account of your objectives, or your financial situation. We aim to bring you long-term focused analysis driven by fundamental data. Note that our analysis may not factor in the latest price-sensitive company announcements or qualitative material. Simply Wall St has no position in any stocks mentioned.
