
 Yahoo Finance
 What Type Of Returns Would Celestica's(TSE:CLS) Shareholders Have Earned If They Purchased Their Shares Three Years Ago?
In order to justify the effort of selecting individual stocks, it's worth striving to beat the returns from a market index fund. But the risk of stock picking is that you will likely buy under-performing companies. We regret to report that long term Celestica Inc. (TSE:CLS) shareholders have had that experience, with the share price dropping 35% in three years, versus a market return of about 32%.
View our latest analysis for Celestica
To quote Buffett, 'Ships will sail around the world but the Flat Earth Society will flourish. There will continue to be wide discrepancies between price and value in the marketplace...' One imperfect but simple way to consider how the market perception of a company has shifted is to compare the change in the earnings per share (EPS) with the share price movement.
Celestica became profitable within the last five years. That would generally be considered a positive, so we are surprised to see the share price is down. So it's worth looking at other metrics to try to understand the share price move.
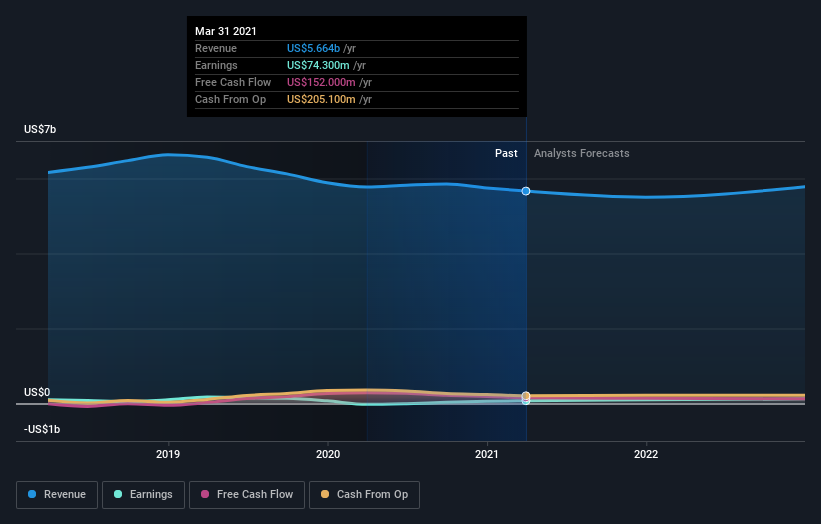
We think that the revenue decline over three years, at a rate of 4.6% per year, probably had some shareholders looking to sell. And that's not surprising, since it seems unlikely that EPS growth can continue for long in the absence of revenue growth.
The graphic below depicts how earnings and revenue have changed over time (unveil the exact values by clicking on the image).
We know that Celestica has improved its bottom line lately, but what does the future have in store? You can see what analysts are predicting for Celestica in this interactive graph of future profit estimates.
A Different Perspective
Celestica shareholders are up 3.1% for the year. But that was short of the market average. But at least that's still a gain! Over five years the TSR has been a reduction of 4% per year, over five years. It could well be that the business is stabilizing. If you would like to research Celestica in more detail then you might want to take a look at whether insiders have been buying or selling shares in the company.
Of course, you might find a fantastic investment by looking elsewhere. So take a peek at this free list of companies we expect will grow earnings.
Please note, the market returns quoted in this article reflect the market weighted average returns of stocks that currently trade on CA exchanges.
This article by Simply Wall St is general in nature. It does not constitute a recommendation to buy or sell any stock, and does not take account of your objectives, or your financial situation. We aim to bring you long-term focused analysis driven by fundamental data. Note that our analysis may not factor in the latest price-sensitive company announcements or qualitative material. Simply Wall St has no position in any stocks mentioned.
Have feedback on this article? Concerned about the content? Get in touch with us directly. Alternatively, email editorial-team (at) simplywallst.com.
