
 Yahoo Finance
 TWC Enterprises (TSE:TWC) Shareholders Will Want The ROCE Trajectory To Continue
If you're not sure where to start when looking for the next multi-bagger, there are a few key trends you should keep an eye out for. Firstly, we'd want to identify a growing return on capital employed (ROCE) and then alongside that, an ever-increasing base of capital employed. Ultimately, this demonstrates that it's a business that is reinvesting profits at increasing rates of return. So when we looked at TWC Enterprises (TSE:TWC) and its trend of ROCE, we really liked what we saw.
Understanding Return On Capital Employed (ROCE)
If you haven't worked with ROCE before, it measures the 'return' (pre-tax profit) a company generates from capital employed in its business. Analysts use this formula to calculate it for TWC Enterprises:
Return on Capital Employed = Earnings Before Interest and Tax (EBIT) ÷ (Total Assets - Current Liabilities)
0.053 = CA$34m ÷ (CA$750m - CA$107m) (Based on the trailing twelve months to September 2023).
So, TWC Enterprises has an ROCE of 5.3%. Ultimately, that's a low return and it under-performs the Hospitality industry average of 11%.
View our latest analysis for TWC Enterprises
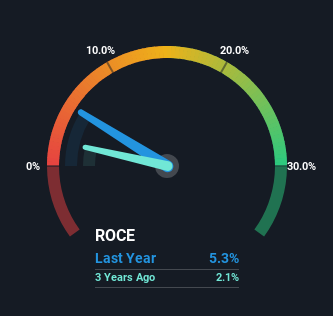
Historical performance is a great place to start when researching a stock so above you can see the gauge for TWC Enterprises' ROCE against it's prior returns. If you're interested in investigating TWC Enterprises' past further, check out this free graph of past earnings, revenue and cash flow.
What Does the ROCE Trend For TWC Enterprises Tell Us?
TWC Enterprises is showing promise given that its ROCE is trending up and to the right. More specifically, while the company has kept capital employed relatively flat over the last five years, the ROCE has climbed 126% in that same time. So it's likely that the business is now reaping the full benefits of its past investments, since the capital employed hasn't changed considerably. The company is doing well in that sense, and it's worth investigating what the management team has planned for long term growth prospects.
In Conclusion...
As discussed above, TWC Enterprises appears to be getting more proficient at generating returns since capital employed has remained flat but earnings (before interest and tax) are up. Investors may not be impressed by the favorable underlying trends yet because over the last five years the stock has only returned 38% to shareholders. So exploring more about this stock could uncover a good opportunity, if the valuation and other metrics stack up.
If you want to continue researching TWC Enterprises, you might be interested to know about the 2 warning signs that our analysis has discovered.
For those who like to invest in solid companies, check out this free list of companies with solid balance sheets and high returns on equity.
Have feedback on this article? Concerned about the content? Get in touch with us directly. Alternatively, email editorial-team (at) simplywallst.com.
This article by Simply Wall St is general in nature. We provide commentary based on historical data and analyst forecasts only using an unbiased methodology and our articles are not intended to be financial advice. It does not constitute a recommendation to buy or sell any stock, and does not take account of your objectives, or your financial situation. We aim to bring you long-term focused analysis driven by fundamental data. Note that our analysis may not factor in the latest price-sensitive company announcements or qualitative material. Simply Wall St has no position in any stocks mentioned.
