
 Yahoo Finance
 Is TTM Technologies (NASDAQ:TTMI) Using Too Much Debt?
The external fund manager backed by Berkshire Hathaway's Charlie Munger, Li Lu, makes no bones about it when he says 'The biggest investment risk is not the volatility of prices, but whether you will suffer a permanent loss of capital.' So it might be obvious that you need to consider debt, when you think about how risky any given stock is, because too much debt can sink a company. As with many other companies TTM Technologies, Inc. (NASDAQ:TTMI) makes use of debt. But the real question is whether this debt is making the company risky.
When Is Debt Dangerous?
Debt assists a business until the business has trouble paying it off, either with new capital or with free cash flow. Ultimately, if the company can't fulfill its legal obligations to repay debt, shareholders could walk away with nothing. However, a more frequent (but still costly) occurrence is where a company must issue shares at bargain-basement prices, permanently diluting shareholders, just to shore up its balance sheet. By replacing dilution, though, debt can be an extremely good tool for businesses that need capital to invest in growth at high rates of return. The first thing to do when considering how much debt a business uses is to look at its cash and debt together.
See our latest analysis for TTM Technologies
What Is TTM Technologies's Debt?
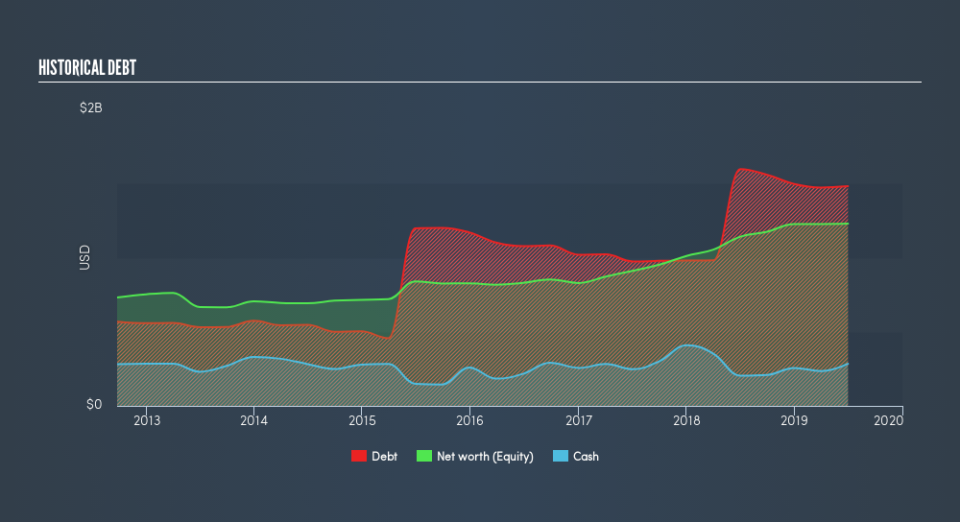
As you can see below, TTM Technologies had US$1.48b of debt at July 2019, down from US$1.60b a year prior. On the flip side, it has US$284.5m in cash leading to net debt of about US$1.20b.
How Strong Is TTM Technologies's Balance Sheet?
According to the last reported balance sheet, TTM Technologies had liabilities of US$624.0m due within 12 months, and liabilities of US$1.59b due beyond 12 months. Offsetting this, it had US$284.5m in cash and US$743.8m in receivables that were due within 12 months. So its liabilities total US$1.18b more than the combination of its cash and short-term receivables.
When you consider that this deficiency exceeds the company's US$1.07b market capitalization, you might well be inclined to review the balance sheet, just like one might study a new partner's social media. In the scenario where the company had to clean up its balance sheet quickly, it seems likely shareholders would suffer extensive dilution.
We measure a company's debt load relative to its earnings power by looking at its net debt divided by its earnings before interest, tax, depreciation, and amortization (EBITDA) and by calculating how easily its earnings before interest and tax (EBIT) cover its interest expense (interest cover). The advantage of this approach is that we take into account both the absolute quantum of debt (with net debt to EBITDA) and the actual interest expenses associated with that debt (with its interest cover ratio).
While we wouldn't worry about TTM Technologies's net debt to EBITDA ratio of 3.1, we think its super-low interest cover of 1.8 times is a sign of high leverage. It seems that the business incurs large depreciation and amortisation charges, so maybe its debt load is heavier than it would first appear, since EBITDA is arguably a generous measure of earnings. It seems clear that the cost of borrowing money is negatively impacting returns for shareholders, of late. Investors should also be troubled by the fact that TTM Technologies saw its EBIT drop by 14% over the last twelve months. If that's the way things keep going handling the debt load will be like delivering hot coffees on a pogo stick. The balance sheet is clearly the area to focus on when you are analysing debt. But it is future earnings, more than anything, that will determine TTM Technologies's ability to maintain a healthy balance sheet going forward. So if you're focused on the future you can check out this free report showing analyst profit forecasts.
Finally, a company can only pay off debt with cold hard cash, not accounting profits. So we clearly need to look at whether that EBIT is leading to corresponding free cash flow. Over the last three years, TTM Technologies recorded free cash flow worth a fulsome 92% of its EBIT, which is stronger than we'd usually expect. That positions it well to pay down debt if desirable to do so.
Our View
To be frank both TTM Technologies's EBIT growth rate and its track record of covering its interest expense with its EBIT make us rather uncomfortable with its debt levels. But on the bright side, its conversion of EBIT to free cash flow is a good sign, and makes us more optimistic. Overall, we think it's fair to say that TTM Technologies has enough debt that there are some real risks around the balance sheet. If all goes well, that should boost returns, but on the flip side, the risk of permanent capital loss is elevated by the debt. Given our hesitation about the stock, it would be good to know if TTM Technologies insiders have sold any shares recently. You click here to find out if insiders have sold recently.
At the end of the day, it's often better to focus on companies that are free from net debt. You can access our special list of such companies (all with a track record of profit growth). It's free.
We aim to bring you long-term focused research analysis driven by fundamental data. Note that our analysis may not factor in the latest price-sensitive company announcements or qualitative material.
If you spot an error that warrants correction, please contact the editor at editorial-team@simplywallst.com. This article by Simply Wall St is general in nature. It does not constitute a recommendation to buy or sell any stock, and does not take account of your objectives, or your financial situation. Simply Wall St has no position in the stocks mentioned. Thank you for reading.
