
 Yahoo Finance
 The total return for Virtu Financial (NASDAQ:VIRT) investors has risen faster than earnings growth over the last five years
Virtu Financial, Inc. (NASDAQ:VIRT) shareholders might understandably be very concerned that the share price has dropped 36% in the last quarter. But at least the stock is up over the last five years. In that time, it is up 30%, which isn't bad, but is below the market return of 59%.
In light of the stock dropping 4.5% in the past week, we want to investigate the longer term story, and see if fundamentals have been the driver of the company's positive five-year return.
Check out our latest analysis for Virtu Financial
In his essay The Superinvestors of Graham-and-Doddsville Warren Buffett described how share prices do not always rationally reflect the value of a business. One way to examine how market sentiment has changed over time is to look at the interaction between a company's share price and its earnings per share (EPS).
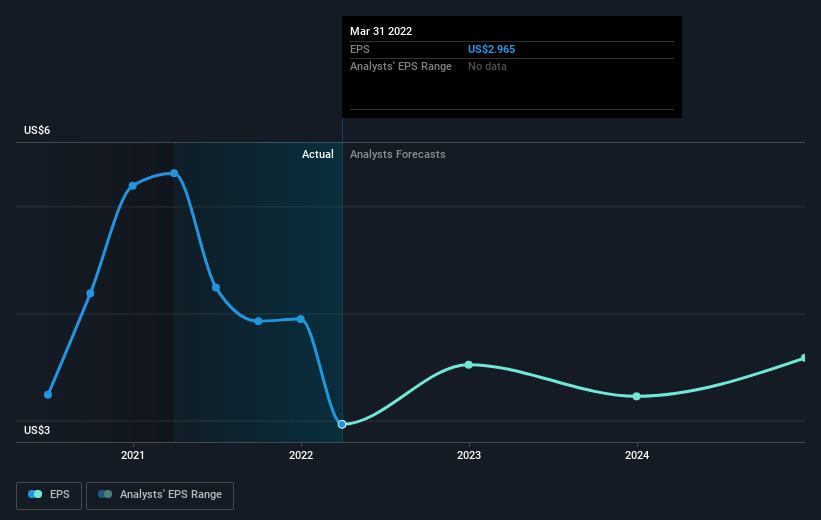
Over half a decade, Virtu Financial managed to grow its earnings per share at 37% a year. This EPS growth is higher than the 5% average annual increase in the share price. So it seems the market isn't so enthusiastic about the stock these days. This cautious sentiment is reflected in its (fairly low) P/E ratio of 7.09.
You can see how EPS has changed over time in the image below (click on the chart to see the exact values).
It is of course excellent to see how Virtu Financial has grown profits over the years, but the future is more important for shareholders. You can see how its balance sheet has strengthened (or weakened) over time in this free interactive graphic.
What About Dividends?
It is important to consider the total shareholder return, as well as the share price return, for any given stock. Whereas the share price return only reflects the change in the share price, the TSR includes the value of dividends (assuming they were reinvested) and the benefit of any discounted capital raising or spin-off. Arguably, the TSR gives a more comprehensive picture of the return generated by a stock. As it happens, Virtu Financial's TSR for the last 5 years was 60%, which exceeds the share price return mentioned earlier. And there's no prize for guessing that the dividend payments largely explain the divergence!
A Different Perspective
Virtu Financial shareholders are down 20% over twelve months (even including dividends), which isn't far from the market return of -21%. Longer term investors wouldn't be so upset, since they would have made 10%, each year, over five years. If the fundamental data remains strong, and the share price is simply down on sentiment, then this could be an opportunity worth investigating. It's always interesting to track share price performance over the longer term. But to understand Virtu Financial better, we need to consider many other factors. Consider risks, for instance. Every company has them, and we've spotted 4 warning signs for Virtu Financial you should know about.
For those who like to find winning investments this free list of growing companies with recent insider purchasing, could be just the ticket.
Please note, the market returns quoted in this article reflect the market weighted average returns of stocks that currently trade on US exchanges.
Have feedback on this article? Concerned about the content? Get in touch with us directly. Alternatively, email editorial-team (at) simplywallst.com.
This article by Simply Wall St is general in nature. We provide commentary based on historical data and analyst forecasts only using an unbiased methodology and our articles are not intended to be financial advice. It does not constitute a recommendation to buy or sell any stock, and does not take account of your objectives, or your financial situation. We aim to bring you long-term focused analysis driven by fundamental data. Note that our analysis may not factor in the latest price-sensitive company announcements or qualitative material. Simply Wall St has no position in any stocks mentioned.
