
 Yahoo Finance
 The total return for Universal Display (NASDAQ:OLED) investors has risen faster than earnings growth over the last five years
Universal Display Corporation (NASDAQ:OLED) shareholders have seen the share price descend 14% over the month. But at least the stock is up over the last five years. However we are not very impressed because the share price is only up 40%, less than the market return of 64%.
Since the long term performance has been good but there's been a recent pullback of 3.2%, let's check if the fundamentals match the share price.
See our latest analysis for Universal Display
In his essay The Superinvestors of Graham-and-Doddsville Warren Buffett described how share prices do not always rationally reflect the value of a business. One imperfect but simple way to consider how the market perception of a company has shifted is to compare the change in the earnings per share (EPS) with the share price movement.
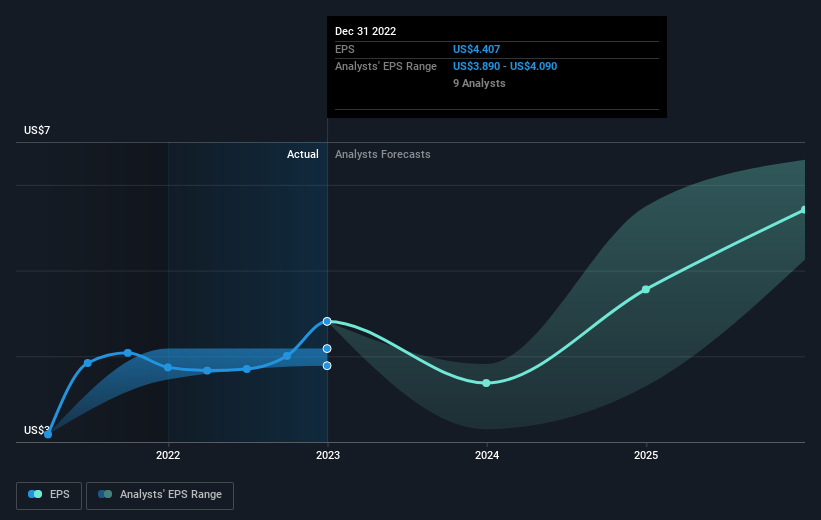
During five years of share price growth, Universal Display achieved compound earnings per share (EPS) growth of 15% per year. This EPS growth is higher than the 7% average annual increase in the share price. So one could conclude that the broader market has become more cautious towards the stock.
You can see below how EPS has changed over time (discover the exact values by clicking on the image).
We know that Universal Display has improved its bottom line lately, but is it going to grow revenue? Check if analysts think Universal Display will grow revenue in the future.
What About Dividends?
It is important to consider the total shareholder return, as well as the share price return, for any given stock. The TSR is a return calculation that accounts for the value of cash dividends (assuming that any dividend received was reinvested) and the calculated value of any discounted capital raisings and spin-offs. So for companies that pay a generous dividend, the TSR is often a lot higher than the share price return. In the case of Universal Display, it has a TSR of 43% for the last 5 years. That exceeds its share price return that we previously mentioned. This is largely a result of its dividend payments!
A Different Perspective
We're pleased to report that Universal Display shareholders have received a total shareholder return of 1.7% over one year. That's including the dividend. Having said that, the five-year TSR of 7% a year, is even better. The pessimistic view would be that be that the stock has its best days behind it, but on the other hand the price might simply be moderating while the business itself continues to execute. While it is well worth considering the different impacts that market conditions can have on the share price, there are other factors that are even more important. Take risks, for example - Universal Display has 2 warning signs (and 1 which shouldn't be ignored) we think you should know about.
We will like Universal Display better if we see some big insider buys. While we wait, check out this free list of growing companies with considerable, recent, insider buying.
Please note, the market returns quoted in this article reflect the market weighted average returns of stocks that currently trade on American exchanges.
Have feedback on this article? Concerned about the content? Get in touch with us directly. Alternatively, email editorial-team (at) simplywallst.com.
This article by Simply Wall St is general in nature. We provide commentary based on historical data and analyst forecasts only using an unbiased methodology and our articles are not intended to be financial advice. It does not constitute a recommendation to buy or sell any stock, and does not take account of your objectives, or your financial situation. We aim to bring you long-term focused analysis driven by fundamental data. Note that our analysis may not factor in the latest price-sensitive company announcements or qualitative material. Simply Wall St has no position in any stocks mentioned.
Join A Paid User Research Session
You’ll receive a US$30 Amazon Gift card for 1 hour of your time while helping us build better investing tools for the individual investors like yourself. Sign up here
