
 Yahoo Finance
 Total Energy Services' (TSE:TOT) Returns On Capital Are Heading Higher
Did you know there are some financial metrics that can provide clues of a potential multi-bagger? In a perfect world, we'd like to see a company investing more capital into its business and ideally the returns earned from that capital are also increasing. Put simply, these types of businesses are compounding machines, meaning they are continually reinvesting their earnings at ever-higher rates of return. With that in mind, we've noticed some promising trends at Total Energy Services (TSE:TOT) so let's look a bit deeper.
Return On Capital Employed (ROCE): What Is It?
For those who don't know, ROCE is a measure of a company's yearly pre-tax profit (its return), relative to the capital employed in the business. Analysts use this formula to calculate it for Total Energy Services:
Return on Capital Employed = Earnings Before Interest and Tax (EBIT) ÷ (Total Assets - Current Liabilities)
0.12 = CA$80m ÷ (CA$862m - CA$177m) (Based on the trailing twelve months to December 2023).
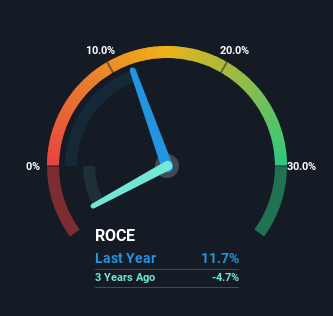
So, Total Energy Services has an ROCE of 12%. In absolute terms, that's a pretty normal return, and it's somewhat close to the Energy Services industry average of 14%.
Check out our latest analysis for Total Energy Services
Above you can see how the current ROCE for Total Energy Services compares to its prior returns on capital, but there's only so much you can tell from the past. If you'd like to see what analysts are forecasting going forward, you should check out our free analyst report for Total Energy Services .
What Can We Tell From Total Energy Services' ROCE Trend?
We're pretty happy with how the ROCE has been trending at Total Energy Services. The data shows that returns on capital have increased by 243% over the trailing five years. That's a very favorable trend because this means that the company is earning more per dollar of capital that's being employed. In regards to capital employed, Total Energy Services appears to been achieving more with less, since the business is using 24% less capital to run its operation. Total Energy Services may be selling some assets so it's worth investigating if the business has plans for future investments to increase returns further still.
Our Take On Total Energy Services' ROCE
From what we've seen above, Total Energy Services has managed to increase it's returns on capital all the while reducing it's capital base. Considering the stock has delivered 16% to its stockholders over the last five years, it may be fair to think that investors aren't fully aware of the promising trends yet. So exploring more about this stock could uncover a good opportunity, if the valuation and other metrics stack up.
One more thing to note, we've identified 1 warning sign with Total Energy Services and understanding it should be part of your investment process.
While Total Energy Services may not currently earn the highest returns, we've compiled a list of companies that currently earn more than 25% return on equity. Check out this free list here.
Have feedback on this article? Concerned about the content? Get in touch with us directly. Alternatively, email editorial-team (at) simplywallst.com.
This article by Simply Wall St is general in nature. We provide commentary based on historical data and analyst forecasts only using an unbiased methodology and our articles are not intended to be financial advice. It does not constitute a recommendation to buy or sell any stock, and does not take account of your objectives, or your financial situation. We aim to bring you long-term focused analysis driven by fundamental data. Note that our analysis may not factor in the latest price-sensitive company announcements or qualitative material. Simply Wall St has no position in any stocks mentioned.
