
 Yahoo Finance
 Torrid Holdings (NYSE:CURV) adds US$188m to market cap in the past 7 days, though investors from a year ago are still down 80%
Torrid Holdings Inc. (NYSE:CURV) has rebounded strongly over the last week, with the share price soaring 42%. But that hardly compensates for the shocking decline over the last twelve months. Specifically, the stock price nose-dived 80% in that time. Arguably, the recent bounce is to be expected after such a bad drop. The bigger issue is whether the company can sustain the momentum in the long term.
On a more encouraging note the company has added US$188m to its market cap in just the last 7 days, so let's see if we can determine what's driven the one-year loss for shareholders.
See our latest analysis for Torrid Holdings
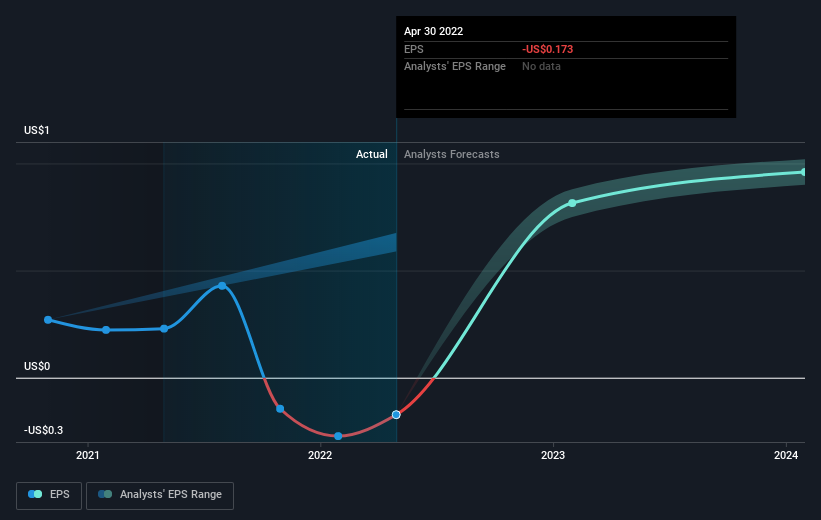
While the efficient markets hypothesis continues to be taught by some, it has been proven that markets are over-reactive dynamic systems, and investors are not always rational. One way to examine how market sentiment has changed over time is to look at the interaction between a company's share price and its earnings per share (EPS).
During the last year Torrid Holdings saw its earnings per share drop below zero. Some investors no doubt dumped the stock as a result. However, there may be an opportunity for investors if the company can recover.
You can see below how EPS has changed over time (discover the exact values by clicking on the image).
We're pleased to report that the CEO is remunerated more modestly than most CEOs at similarly capitalized companies. It's always worth keeping an eye on CEO pay, but a more important question is whether the company will grow earnings throughout the years. Dive deeper into the earnings by checking this interactive graph of Torrid Holdings' earnings, revenue and cash flow.
A Different Perspective
Torrid Holdings shareholders are down 80% for the year, even worse than the market loss of 10%. That's disappointing, but it's worth keeping in mind that the market-wide selling wouldn't have helped. It's great to see a nice little 16% rebound in the last three months. This could just be a bounce because the selling was too aggressive, but fingers crossed it's the start of a new trend. While it is well worth considering the different impacts that market conditions can have on the share price, there are other factors that are even more important. Consider risks, for instance. Every company has them, and we've spotted 2 warning signs for Torrid Holdings you should know about.
If you like to buy stocks alongside management, then you might just love this free list of companies. (Hint: insiders have been buying them).
Please note, the market returns quoted in this article reflect the market weighted average returns of stocks that currently trade on US exchanges.
Have feedback on this article? Concerned about the content? Get in touch with us directly. Alternatively, email editorial-team (at) simplywallst.com.
This article by Simply Wall St is general in nature. We provide commentary based on historical data and analyst forecasts only using an unbiased methodology and our articles are not intended to be financial advice. It does not constitute a recommendation to buy or sell any stock, and does not take account of your objectives, or your financial situation. We aim to bring you long-term focused analysis driven by fundamental data. Note that our analysis may not factor in the latest price-sensitive company announcements or qualitative material. Simply Wall St has no position in any stocks mentioned.
Join A Paid User Research Session
You’ll receive a US$30 Amazon Gift card for 1 hour of your time while helping us build better investing tools for the individual investors like yourself. Sign up here
