
 Yahoo Finance
 Topgolf Callaway Brands (NYSE:MODG) shareholders have endured a 47% loss from investing in the stock three years ago
While it may not be enough for some shareholders, we think it is good to see the Topgolf Callaway Brands Corp. (NYSE:MODG) share price up 13% in a single quarter. But that cannot eclipse the less-than-impressive returns over the last three years. After all, the share price is down 47% in the last three years, significantly under-performing the market.
So let's have a look and see if the longer term performance of the company has been in line with the underlying business' progress.
View our latest analysis for Topgolf Callaway Brands
To paraphrase Benjamin Graham: Over the short term the market is a voting machine, but over the long term it's a weighing machine. One flawed but reasonable way to assess how sentiment around a company has changed is to compare the earnings per share (EPS) with the share price.
During five years of share price growth, Topgolf Callaway Brands moved from a loss to profitability. That would generally be considered a positive, so we are surprised to see the share price is down. So given the share price is down it's worth checking some other metrics too.
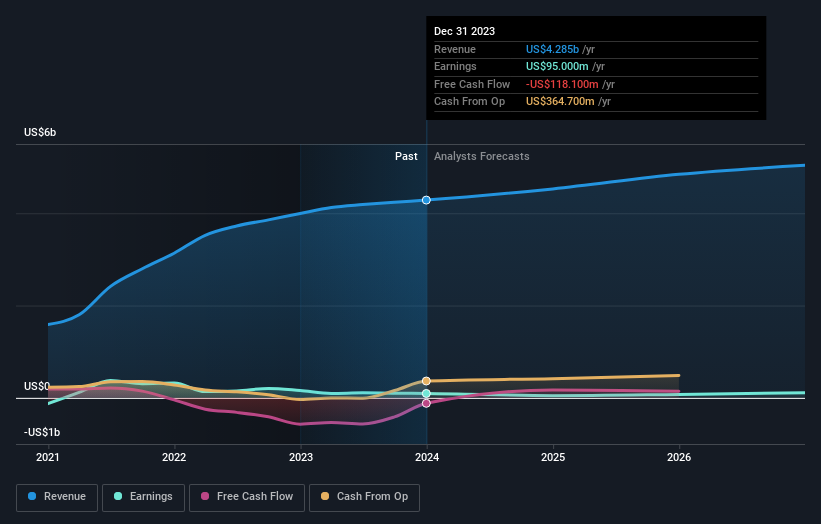
We note that, in three years, revenue has actually grown at a 27% annual rate, so that doesn't seem to be a reason to sell shares. It's probably worth investigating Topgolf Callaway Brands further; while we may be missing something on this analysis, there might also be an opportunity.
The graphic below depicts how earnings and revenue have changed over time (unveil the exact values by clicking on the image).
We consider it positive that insiders have made significant purchases in the last year. Having said that, most people consider earnings and revenue growth trends to be a more meaningful guide to the business. So it makes a lot of sense to check out what analysts think Topgolf Callaway Brands will earn in the future (free profit forecasts).
A Different Perspective
While the broader market gained around 21% in the last year, Topgolf Callaway Brands shareholders lost 29%. Even the share prices of good stocks drop sometimes, but we want to see improvements in the fundamental metrics of a business, before getting too interested. Unfortunately, last year's performance may indicate unresolved challenges, given that it was worse than the annualised loss of 1.9% over the last half decade. Generally speaking long term share price weakness can be a bad sign, though contrarian investors might want to research the stock in hope of a turnaround. It's always interesting to track share price performance over the longer term. But to understand Topgolf Callaway Brands better, we need to consider many other factors. For instance, we've identified 2 warning signs for Topgolf Callaway Brands that you should be aware of.
If you like to buy stocks alongside management, then you might just love this free list of companies. (Hint: insiders have been buying them).
Please note, the market returns quoted in this article reflect the market weighted average returns of stocks that currently trade on American exchanges.
Have feedback on this article? Concerned about the content? Get in touch with us directly. Alternatively, email editorial-team (at) simplywallst.com.
This article by Simply Wall St is general in nature. We provide commentary based on historical data and analyst forecasts only using an unbiased methodology and our articles are not intended to be financial advice. It does not constitute a recommendation to buy or sell any stock, and does not take account of your objectives, or your financial situation. We aim to bring you long-term focused analysis driven by fundamental data. Note that our analysis may not factor in the latest price-sensitive company announcements or qualitative material. Simply Wall St has no position in any stocks mentioned.
