
 Yahoo Finance
 Is It Too Late To Consider Buying Chart Industries, Inc. (NASDAQ:GTLS)?

Want to participate in a short research study? Help shape the future of investing tools and receive a $20 prize!
Chart Industries, Inc. (NASDAQ:GTLS), which is in the machinery business, and is based in United States, saw a significant share price rise of over 20% in the past couple of months on the NASDAQGS. With many analysts covering the mid-cap stock, we may expect any price-sensitive announcements have already been factored into the stock’s share price. But what if there is still an opportunity to buy? Let’s examine Chart Industries’s valuation and outlook in more detail to determine if there’s still a bargain opportunity.
View our latest analysis for Chart Industries
What’s the opportunity in Chart Industries?
According to my relative valuation model, the stock is currently overvalued. I’ve used the price-to-earnings ratio in this instance because there’s not enough visibility to forecast its cash flows. The stock’s ratio of 51.07x is currently well-above the industry average of 19.67x, meaning that it is trading at a more expensive price relative to its peers. If you like the stock, you may want to keep an eye out for a potential price decline in the future. Given that Chart Industries’s share is fairly volatile (i.e. its price movements are magnified relative to the rest of the market) this could mean the price can sink lower, giving us another chance to buy in the future. This is based on its high beta, which is a good indicator for share price volatility.
Can we expect growth from Chart Industries?
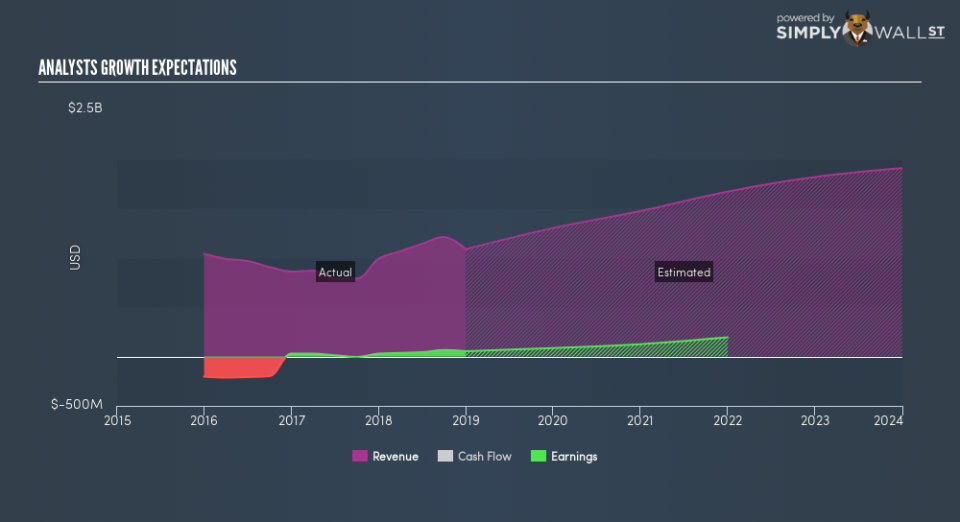
Future outlook is an important aspect when you’re looking at buying a stock, especially if you are an investor looking for growth in your portfolio. Although value investors would argue that it’s the intrinsic value relative to the price that matter the most, a more compelling investment thesis would be high growth potential at a cheap price. With profit expected to more than double over the next couple of years, the future seems bright for Chart Industries. It looks like higher cash flow is on the cards for the stock, which should feed into a higher share valuation.
What this means for you:
Are you a shareholder? It seems like the market has well and truly priced in GTLS’s positive outlook, with shares trading above its fair value. However, this brings up another question – is now the right time to sell? If you believe GTLS should trade below its current price, selling high and buying it back up again when its price falls towards its real value can be profitable. But before you make this decision, take a look at whether its fundamentals have changed.
Are you a potential investor? If you’ve been keeping an eye on GTLS for a while, now may not be the best time to enter into the stock. The price has surpassed its industry peers, which means it is likely that there is no more upside from mispricing. However, the positive outlook is encouraging for GTLS, which means it’s worth diving deeper into other factors in order to take advantage of the next price drop.
Price is just the tip of the iceberg. Dig deeper into what truly matters – the fundamentals – before you make a decision on Chart Industries. You can find everything you need to know about Chart Industries in the latest infographic research report. If you are no longer interested in Chart Industries, you can use our free platform to see my list of over 50 other stocks with a high growth potential.
We aim to bring you long-term focused research analysis driven by fundamental data. Note that our analysis may not factor in the latest price-sensitive company announcements or qualitative material.
If you spot an error that warrants correction, please contact the editor at editorial-team@simplywallst.com. This article by Simply Wall St is general in nature. It does not constitute a recommendation to buy or sell any stock, and does not take account of your objectives, or your financial situation. Simply Wall St has no position in the stocks mentioned. On rare occasion, data errors may occur. Thank you for reading.
