
 Yahoo Finance
 Titan Mining (TSE:TI) Is Experiencing Growth In Returns On Capital
What are the early trends we should look for to identify a stock that could multiply in value over the long term? Amongst other things, we'll want to see two things; firstly, a growing return on capital employed (ROCE) and secondly, an expansion in the company's amount of capital employed. This shows us that it's a compounding machine, able to continually reinvest its earnings back into the business and generate higher returns. With that in mind, we've noticed some promising trends at Titan Mining (TSE:TI) so let's look a bit deeper.
What is Return On Capital Employed (ROCE)?
Just to clarify if you're unsure, ROCE is a metric for evaluating how much pre-tax income (in percentage terms) a company earns on the capital invested in its business. To calculate this metric for Titan Mining, this is the formula:
Return on Capital Employed = Earnings Before Interest and Tax (EBIT) ÷ (Total Assets - Current Liabilities)
0.023 = US$1.6m ÷ (US$78m - US$6.7m) (Based on the trailing twelve months to December 2021).
Thus, Titan Mining has an ROCE of 2.3%. On its own, that's a low figure but it's around the 2.7% average generated by the Metals and Mining industry.
Check out our latest analysis for Titan Mining
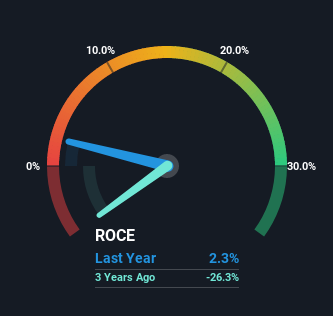
Historical performance is a great place to start when researching a stock so above you can see the gauge for Titan Mining's ROCE against it's prior returns. If you're interested in investigating Titan Mining's past further, check out this free graph of past earnings, revenue and cash flow.
How Are Returns Trending?
We're delighted to see that Titan Mining is reaping rewards from its investments and is now generating some pre-tax profits. Shareholders would no doubt be pleased with this because the business was loss-making five years ago but is is now generating 2.3% on its capital. Not only that, but the company is utilizing 190% more capital than before, but that's to be expected from a company trying to break into profitability. This can indicate that there's plenty of opportunities to invest capital internally and at ever higher rates, both common traits of a multi-bagger.
One more thing to note, Titan Mining has decreased current liabilities to 8.6% of total assets over this period, which effectively reduces the amount of funding from suppliers or short-term creditors. So shareholders would be pleased that the growth in returns has mostly come from underlying business performance.
What We Can Learn From Titan Mining's ROCE
Overall, Titan Mining gets a big tick from us thanks in most part to the fact that it is now profitable and is reinvesting in its business. And investors seem to expect more of this going forward, since the stock has rewarded shareholders with a 71% return over the last three years. So given the stock has proven it has promising trends, it's worth researching the company further to see if these trends are likely to persist.
One final note, you should learn about the 4 warning signs we've spotted with Titan Mining (including 1 which is concerning) .
For those who like to invest in solid companies, check out this free list of companies with solid balance sheets and high returns on equity.
Have feedback on this article? Concerned about the content? Get in touch with us directly. Alternatively, email editorial-team (at) simplywallst.com.
This article by Simply Wall St is general in nature. We provide commentary based on historical data and analyst forecasts only using an unbiased methodology and our articles are not intended to be financial advice. It does not constitute a recommendation to buy or sell any stock, and does not take account of your objectives, or your financial situation. We aim to bring you long-term focused analysis driven by fundamental data. Note that our analysis may not factor in the latest price-sensitive company announcements or qualitative material. Simply Wall St has no position in any stocks mentioned.
