
 Yahoo Finance
 TimkenSteel (NYSE:TMST) Is Experiencing Growth In Returns On Capital
Did you know there are some financial metrics that can provide clues of a potential multi-bagger? Firstly, we'd want to identify a growing return on capital employed (ROCE) and then alongside that, an ever-increasing base of capital employed. This shows us that it's a compounding machine, able to continually reinvest its earnings back into the business and generate higher returns. So when we looked at TimkenSteel (NYSE:TMST) and its trend of ROCE, we really liked what we saw.
What is Return On Capital Employed (ROCE)?
For those that aren't sure what ROCE is, it measures the amount of pre-tax profits a company can generate from the capital employed in its business. To calculate this metric for TimkenSteel, this is the formula:
Return on Capital Employed = Earnings Before Interest and Tax (EBIT) ÷ (Total Assets - Current Liabilities)
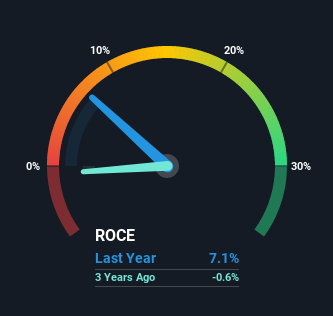
0.071 = US$59m ÷ (US$1.1b - US$236m) (Based on the trailing twelve months to June 2021).
Therefore, TimkenSteel has an ROCE of 7.1%. In absolute terms, that's a low return and it also under-performs the Metals and Mining industry average of 12%.
Check out our latest analysis for TimkenSteel
In the above chart we have measured TimkenSteel's prior ROCE against its prior performance, but the future is arguably more important. If you're interested, you can view the analysts predictions in our free report on analyst forecasts for the company.
How Are Returns Trending?
Shareholders will be relieved that TimkenSteel has broken into profitability. While the business was unprofitable in the past, it's now turned things around and is earning 7.1% on its capital. On top of that, what's interesting is that the amount of capital being employed has remained steady, so the business hasn't needed to put any additional money to work to generate these higher returns. That being said, while an increase in efficiency is no doubt appealing, it'd be helpful to know if the company does have any investment plans going forward. So if you're looking for high growth, you'll want to see a business's capital employed also increasing.
For the record though, there was a noticeable increase in the company's current liabilities over the period, so we would attribute some of the ROCE growth to that. Effectively this means that suppliers or short-term creditors are now funding 22% of the business, which is more than it was five years ago. Keep an eye out for future increases because when the ratio of current liabilities to total assets gets particularly high, this can introduce some new risks for the business.
The Bottom Line
To sum it up, TimkenSteel is collecting higher returns from the same amount of capital, and that's impressive. Considering the stock has delivered 28% to its stockholders over the last five years, it may be fair to think that investors aren't fully aware of the promising trends yet. So with that in mind, we think the stock deserves further research.
Like most companies, TimkenSteel does come with some risks, and we've found 3 warning signs that you should be aware of.
While TimkenSteel isn't earning the highest return, check out this free list of companies that are earning high returns on equity with solid balance sheets.
This article by Simply Wall St is general in nature. We provide commentary based on historical data and analyst forecasts only using an unbiased methodology and our articles are not intended to be financial advice. It does not constitute a recommendation to buy or sell any stock, and does not take account of your objectives, or your financial situation. We aim to bring you long-term focused analysis driven by fundamental data. Note that our analysis may not factor in the latest price-sensitive company announcements or qualitative material. Simply Wall St has no position in any stocks mentioned.
Have feedback on this article? Concerned about the content? Get in touch with us directly. Alternatively, email editorial-team (at) simplywallst.com.
