
 Yahoo Finance
 Thunderbird Entertainment Group (CVE:TBRD) shareholders have earned a 36% CAGR over the last three years
It might be of some concern to shareholders to see the Thunderbird Entertainment Group Inc. (CVE:TBRD) share price down 18% in the last month. But that doesn't change the fact that the returns over the last three years have been very strong. In three years the stock price has launched 154% higher: a great result. To some, the recent share price pullback wouldn't be surprising after such a good run. The fundamental business performance will ultimately dictate whether the top is in, or if this is a stellar buying opportunity.
So let's investigate and see if the longer term performance of the company has been in line with the underlying business' progress.
Check out our latest analysis for Thunderbird Entertainment Group
To quote Buffett, 'Ships will sail around the world but the Flat Earth Society will flourish. There will continue to be wide discrepancies between price and value in the marketplace...' One imperfect but simple way to consider how the market perception of a company has shifted is to compare the change in the earnings per share (EPS) with the share price movement.
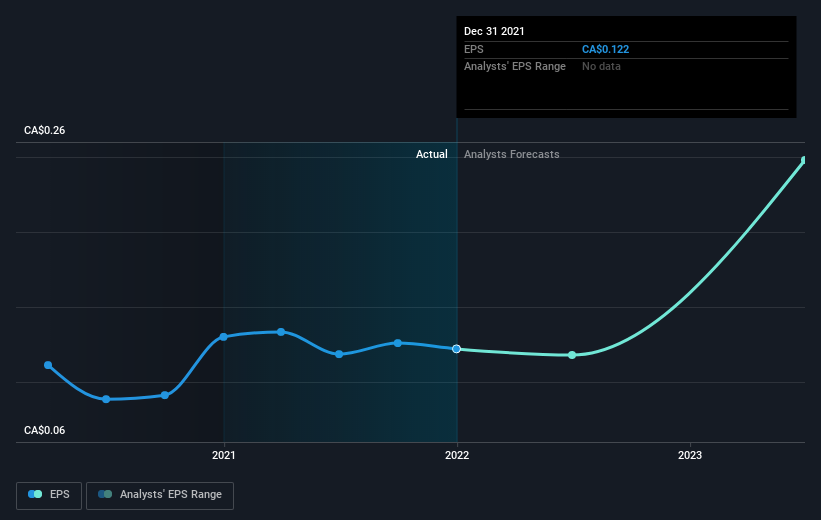
Thunderbird Entertainment Group became profitable within the last three years. Given the importance of this milestone, it's not overly surprising that the share price has increased strongly.
You can see below how EPS has changed over time (discover the exact values by clicking on the image).
It is of course excellent to see how Thunderbird Entertainment Group has grown profits over the years, but the future is more important for shareholders. You can see how its balance sheet has strengthened (or weakened) over time in this free interactive graphic.
A Different Perspective
Over the last year, Thunderbird Entertainment Group shareholders took a loss of 30%. In contrast the market gained about 14%. Of course the long term matters more than the short term, and even great stocks will sometimes have a poor year. Fortunately the longer term story is brighter, with total returns averaging about 36% per year over three years. The recent sell-off could be an opportunity if the business remains sound, so it may be worth checking the fundamental data for signs of a long-term growth trend. It's always interesting to track share price performance over the longer term. But to understand Thunderbird Entertainment Group better, we need to consider many other factors. Consider risks, for instance. Every company has them, and we've spotted 2 warning signs for Thunderbird Entertainment Group you should know about.
We will like Thunderbird Entertainment Group better if we see some big insider buys. While we wait, check out this free list of growing companies with considerable, recent, insider buying.
Please note, the market returns quoted in this article reflect the market weighted average returns of stocks that currently trade on CA exchanges.
Have feedback on this article? Concerned about the content? Get in touch with us directly. Alternatively, email editorial-team (at) simplywallst.com.
This article by Simply Wall St is general in nature. We provide commentary based on historical data and analyst forecasts only using an unbiased methodology and our articles are not intended to be financial advice. It does not constitute a recommendation to buy or sell any stock, and does not take account of your objectives, or your financial situation. We aim to bring you long-term focused analysis driven by fundamental data. Note that our analysis may not factor in the latest price-sensitive company announcements or qualitative material. Simply Wall St has no position in any stocks mentioned.
