
 Yahoo Finance
 Three TSX Dividend Stocks Offering Yields From 5.1% To 7.4%
As central banks like the Bank of Canada (BoC) adjust interest rates in response to shifting economic indicators, investors may find reassurance in the relative stability offered by dividend stocks. In a market environment where cautious optimism mixes with strategic adjustments, dividend-yielding stocks can provide both income and a degree of insulation against volatility.
Top 10 Dividend Stocks In Canada
Name | Dividend Yield | Dividend Rating |
Bank of Nova Scotia (TSX:BNS) | 6.72% | ★★★★★★ |
Whitecap Resources (TSX:WCP) | 7.21% | ★★★★★★ |
Secure Energy Services (TSX:SES) | 3.42% | ★★★★★☆ |
Boston Pizza Royalties Income Fund (TSX:BPF.UN) | 8.32% | ★★★★★☆ |
Enghouse Systems (TSX:ENGH) | 3.35% | ★★★★★☆ |
Royal Bank of Canada (TSX:RY) | 3.77% | ★★★★★☆ |
Firm Capital Mortgage Investment (TSX:FC) | 8.88% | ★★★★★☆ |
Canadian Western Bank (TSX:CWB) | 3.11% | ★★★★★☆ |
Russel Metals (TSX:RUS) | 4.71% | ★★★★★☆ |
Canadian Natural Resources (TSX:CNQ) | 4.28% | ★★★★★☆ |
Click here to see the full list of 33 stocks from our Top TSX Dividend Stocks screener.
We're going to check out a few of the best picks from our screener tool.
Aecon Group
Simply Wall St Dividend Rating: ★★★★☆☆
Overview: Aecon Group Inc. operates in construction and infrastructure development, serving both private and public sectors across Canada, the United States, and internationally, with a market cap of approximately CA$0.90 billion.
Operations: Aecon Group Inc.'s revenue is primarily generated from its Construction segment, which brought in CA$4.33 billion, and its Concessions segment, contributing CA$59.50 million.
Dividend Yield: 5.2%
Aecon Group's recent settlement over the Coastal GasLink Pipeline dispute will not impact its cash position but anticipates a $127 million charge in Q2 2024, with additional expected charges of $110 million. Despite these financial adjustments, Aecon maintains a stable dividend history, recently affirming a quarterly dividend of C$0.19 per share. However, its dividend yield of 5.17% trails the top Canadian payers and is poorly covered by free cash flow due to a high payout ratio (4232.8%), raising concerns about sustainability amidst declining earnings forecasts and significant one-off financial impacts.

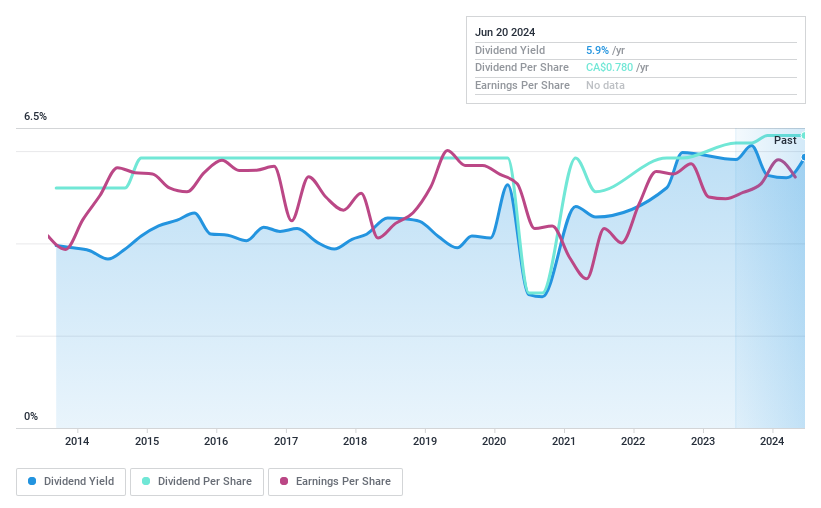
Evertz Technologies
Simply Wall St Dividend Rating: ★★★★☆☆
Overview: Evertz Technologies Limited specializes in designing, manufacturing, and distributing video and audio infrastructure solutions for the production, post-production, broadcast, and telecommunications sectors globally, with a market cap of approximately CA$0.97 billion.
Operations: Evertz Technologies Limited generates CA$514.62 million from its television broadcast equipment market segment.
Dividend Yield: 6%
Evertz Technologies has shown a mixed performance in its dividend profile. Despite a volatile dividend history over the past decade, recent earnings reports indicate stability with an annual increase in net income to CAD 70.17 million from CAD 64.03 million and consistent quarterly dividends of CAD 0.195 per share. The company's dividends are well-covered by both earnings and cash flows, with payout ratios of 84% and 44% respectively, suggesting improved sustainability moving forward. However, its yield remains below the top quartile of Canadian dividend stocks.
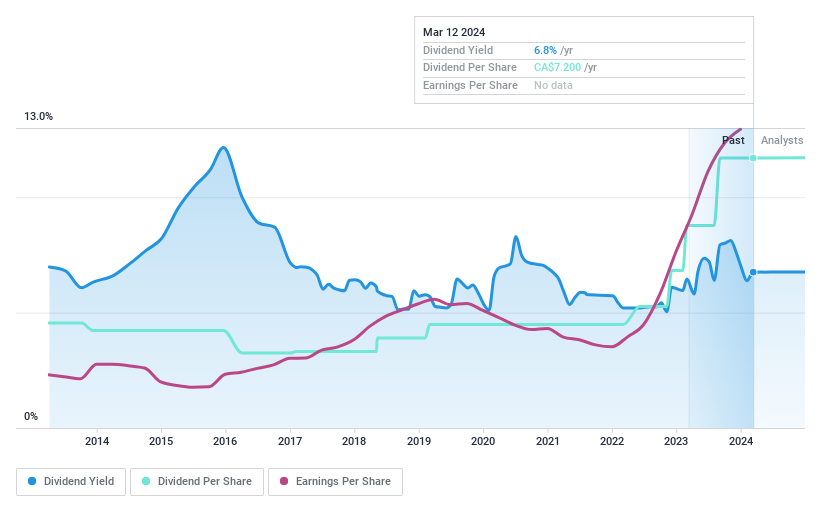
Olympia Financial Group
Simply Wall St Dividend Rating: ★★★★★☆
Overview: Olympia Financial Group Inc. operates in Canada as a non-deposit taking trust company through its subsidiary, Olympia Trust Company, with a market capitalization of approximately CA$234.02 million.
Operations: Olympia Financial Group Inc. generates revenue through several segments, including Health (CA$10.04 million), Corporate (CA$0.18 million), Exempt Edge (CA$1.37 million), Investment Account Services (CA$78.05 million), Currency and Global Payments (CA$8.63 million), and Corporate and Shareholder Services (CA$3.78 million).
Dividend Yield: 7.4%
Olympia Financial Group's recent dividend affirmations, including a consistent monthly cash dividend of CAD 0.60 per share, reflect a stable commitment to shareholder returns. Despite this regularity, the company's dividend history over the past decade has been marked by volatility and unreliability. Financially, Olympia reported a revenue increase to CAD 25.84 million and net income growth to CAD 5.74 million in Q1 2024, supporting its dividends with a payout ratio of 63.4% and cash payout ratio of 76%. However, earnings are expected to decline by an average of 10% annually over the next three years, which could challenge future dividend sustainability despite a current yield that ranks in the top quartile for Canadian stocks.
Key Takeaways
Access the full spectrum of 33 Top TSX Dividend Stocks by clicking on this link.
Got skin in the game with these stocks? Elevate how you manage them by using Simply Wall St's portfolio, where intuitive tools await to help optimize your investment outcomes.
Maximize your investment potential with Simply Wall St, the comprehensive app that offers global market insights for free.
Interested In Other Possibilities?
Explore high-performing small cap companies that haven't yet garnered significant analyst attention.
Fuel your portfolio with companies showing strong growth potential, backed by optimistic outlooks both from analysts and management.
Find companies with promising cash flow potential yet trading below their fair value.
This article by Simply Wall St is general in nature. We provide commentary based on historical data and analyst forecasts only using an unbiased methodology and our articles are not intended to be financial advice. It does not constitute a recommendation to buy or sell any stock, and does not take account of your objectives, or your financial situation. We aim to bring you long-term focused analysis driven by fundamental data. Note that our analysis may not factor in the latest price-sensitive company announcements or qualitative material. Simply Wall St has no position in any stocks mentioned.
Companies discussed in this article include TSX:ARE TSX:ET and TSX:OLY.
Have feedback on this article? Concerned about the content? Get in touch with us directly. Alternatively, email editorial-team@simplywallst.com
