
 Yahoo Finance
 The three-year returns for Brunswick's (NYSE:BC) shareholders have been impressive, yet its earnings growth was even better
It might seem bad, but the worst that can happen when you buy a stock (without leverage) is that its share price goes to zero. But in contrast you can make much more than 100% if the company does well. For instance the Brunswick Corporation (NYSE:BC) share price is 111% higher than it was three years ago. How nice for those who held the stock! Meanwhile the share price is 7.5% higher than it was a week ago.
Since it's been a strong week for Brunswick shareholders, let's have a look at trend of the longer term fundamentals.
View our latest analysis for Brunswick
In his essay The Superinvestors of Graham-and-Doddsville Warren Buffett described how share prices do not always rationally reflect the value of a business. One flawed but reasonable way to assess how sentiment around a company has changed is to compare the earnings per share (EPS) with the share price.
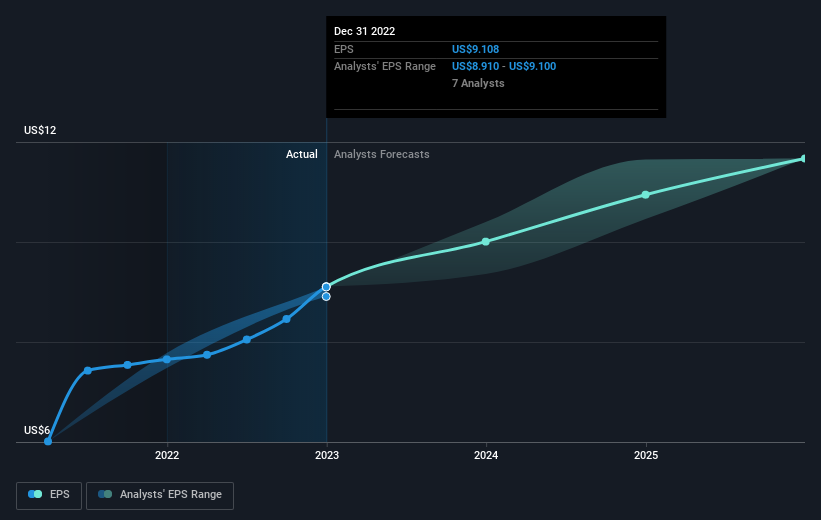
During three years of share price growth, Brunswick achieved compound earnings per share growth of 199% per year. The average annual share price increase of 28% is actually lower than the EPS growth. Therefore, it seems the market has moderated its expectations for growth, somewhat. This cautious sentiment is reflected in its (fairly low) P/E ratio of 8.57.
The company's earnings per share (over time) is depicted in the image below (click to see the exact numbers).
We know that Brunswick has improved its bottom line over the last three years, but what does the future have in store? It might be well worthwhile taking a look at our free report on how its financial position has changed over time.
What About Dividends?
When looking at investment returns, it is important to consider the difference between total shareholder return (TSR) and share price return. The TSR incorporates the value of any spin-offs or discounted capital raisings, along with any dividends, based on the assumption that the dividends are reinvested. So for companies that pay a generous dividend, the TSR is often a lot higher than the share price return. We note that for Brunswick the TSR over the last 3 years was 121%, which is better than the share price return mentioned above. And there's no prize for guessing that the dividend payments largely explain the divergence!
A Different Perspective
We're pleased to report that Brunswick shareholders have received a total shareholder return of 10% over one year. And that does include the dividend. That's better than the annualised return of 8% over half a decade, implying that the company is doing better recently. Given the share price momentum remains strong, it might be worth taking a closer look at the stock, lest you miss an opportunity. While it is well worth considering the different impacts that market conditions can have on the share price, there are other factors that are even more important. For example, we've discovered 1 warning sign for Brunswick that you should be aware of before investing here.
If you are like me, then you will not want to miss this free list of growing companies that insiders are buying.
Please note, the market returns quoted in this article reflect the market weighted average returns of stocks that currently trade on American exchanges.
Have feedback on this article? Concerned about the content? Get in touch with us directly. Alternatively, email editorial-team (at) simplywallst.com.
This article by Simply Wall St is general in nature. We provide commentary based on historical data and analyst forecasts only using an unbiased methodology and our articles are not intended to be financial advice. It does not constitute a recommendation to buy or sell any stock, and does not take account of your objectives, or your financial situation. We aim to bring you long-term focused analysis driven by fundamental data. Note that our analysis may not factor in the latest price-sensitive company announcements or qualitative material. Simply Wall St has no position in any stocks mentioned.
Join A Paid User Research Session
You’ll receive a US$30 Amazon Gift card for 1 hour of your time while helping us build better investing tools for the individual investors like yourself. Sign up here
