
 Yahoo Finance
 Three Japanese Exchange Growth Companies With Insider Ownership Up To 26%
As global markets navigate through varying economic signals, Japan's stock markets have shown resilience, with the Nikkei 225 and TOPIX indices recently hitting all-time highs. This bullish trend underscores a robust environment for growth-oriented companies, particularly those with substantial insider ownership which often signals strong confidence in the company's future prospects from those closest to its operations.
Top 10 Growth Companies With High Insider Ownership In Japan
Name | Insider Ownership | Earnings Growth |
SHIFT (TSE:3697) | 35.4% | 26.9% |
Hottolink (TSE:3680) | 27% | 57.4% |
Kasumigaseki CapitalLtd (TSE:3498) | 34.8% | 42.9% |
Medley (TSE:4480) | 34% | 28.7% |
Micronics Japan (TSE:6871) | 15.3% | 39.8% |
Kanamic NetworkLTD (TSE:3939) | 25% | 28.9% |
ExaWizards (TSE:4259) | 21.9% | 91.1% |
Astroscale Holdings (TSE:186A) | 20.9% | 90% |
Soiken Holdings (TSE:2385) | 19.8% | 118.4% |
freee K.K (TSE:4478) | 23.9% | 72.9% |
We're going to check out a few of the best picks from our screener tool.
Persol HoldingsLtd
Simply Wall St Growth Rating: ★★★★☆☆
Overview: Persol Holdings Co., Ltd. operates globally, offering human resource services under the PERSOL brand, with a market capitalization of approximately ¥572.50 billion.
Operations: The company's revenue is segmented into BPO (¥110.80 billion), Career (¥128.28 billion), Technology (¥102.38 billion), Asia Pacific (¥412.77 billion), and Staffing excluding BPO (¥575.80 billion).
Insider Ownership: 11.8%
Persol Holdings Ltd., a company with substantial insider ownership, has recently completed a significant share buyback, repurchasing shares for ¥3.59 billion. This move underlines its strategy to enhance shareholder returns. While the company's revenue growth at 5.3% per year is modest compared to high-growth benchmarks, its earnings have surged by 45.6% over the past year and are expected to outpace the Japanese market average with a forecasted annual growth of 12%. However, it trades at 54.8% below estimated fair value, suggesting potential undervaluation amidst an unstable dividend track record.
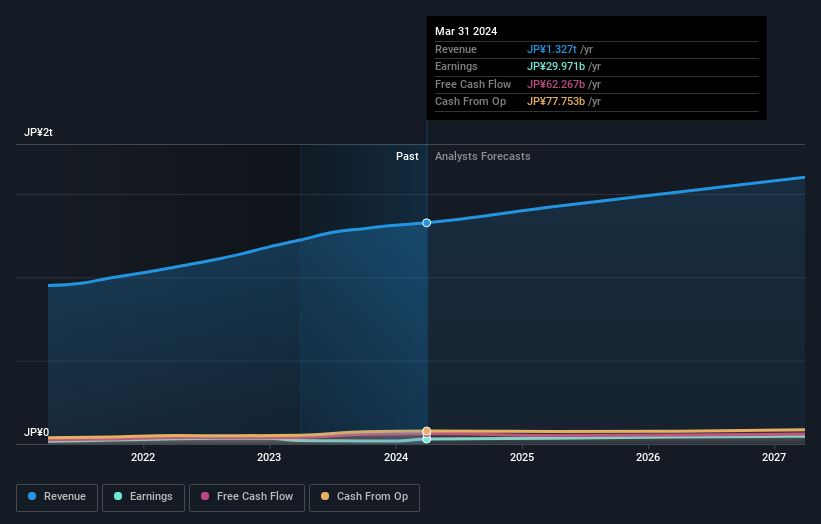
PeptiDream
Simply Wall St Growth Rating: ★★★★★☆
Overview: PeptiDream Inc. is a biopharmaceutical company focused on the discovery and development of constrained peptides, small molecules, and peptide-drug conjugate therapeutics, with a market capitalization of approximately ¥355.58 billion.
Operations: The company generates revenue primarily through its work in the discovery and development of various therapeutic compounds.
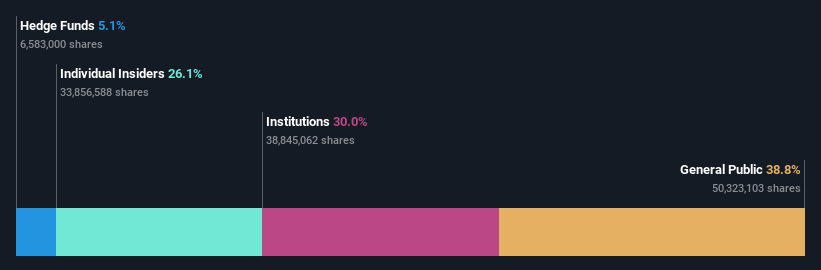
Insider Ownership: 26.1%
PeptiDream, a Japanese biotech firm with high insider ownership, recently announced significant clinical advancements and strategic alliances. On June 4, 2024, it began a pioneering imaging study for renal cell carcinoma diagnostics using its proprietary technology. Additionally, on April 30, PeptiDream expanded its collaboration with Novartis in a deal potentially worth over JPY 422 billion. Despite lower profit margins compared to last year and modest revenue growth predictions (10.5% per year), the company forecasts substantial earnings growth (22.3% annually) over the next three years and maintains a forecasted high return on equity (20.3%).
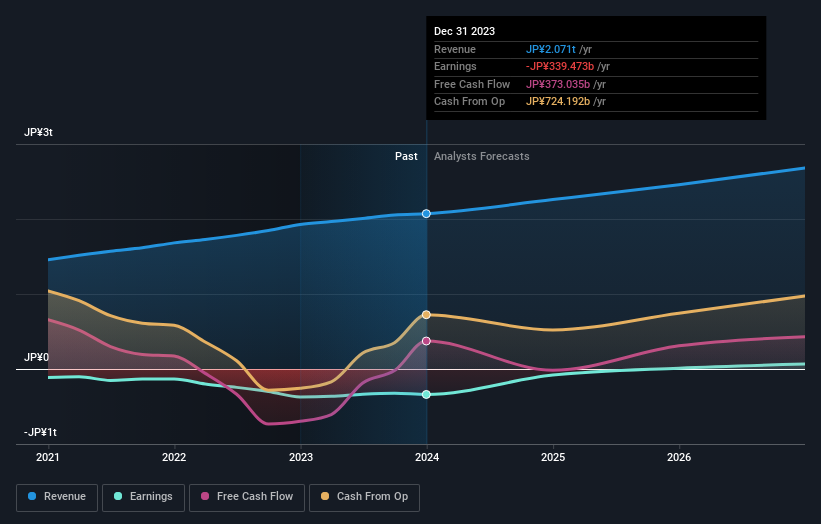
Rakuten Group
Simply Wall St Growth Rating: ★★★★☆☆
Overview: Rakuten Group, Inc. operates in diverse sectors including e-commerce, fintech, digital content, and communications, serving a broad international audience with a market capitalization of approximately ¥1.96 trillion.
Operations: The company generates revenue through its operations in e-commerce, fintech, digital content, and communications sectors.
Insider Ownership: 17.3%
Rakuten Group, a Japanese e-commerce giant, is poised for notable growth with insider ownership bolstering confidence. While its revenue growth at 7.8% annually outpaces the Japanese market average of 4.3%, earnings are expected to surge by an impressive 83.11% annually. Despite trading at 78% below estimated fair value and a modest forecasted return on equity of 8.9%, Rakuten's profitability is anticipated within three years, supported by robust corporate guidance predicting double-digit operational growth excluding volatile securities sectors for FY2024.
Turning Ideas Into Actions
Click through to start exploring the rest of the 97 Fast Growing Japanese Companies With High Insider Ownership now.
Hold shares in these firms? Setup your portfolio in Simply Wall St to seamlessly track your investments and receive personalized updates on your portfolio's performance.
Invest smarter with the free Simply Wall St app providing detailed insights into every stock market around the globe.
Curious About Other Options?
Explore high-performing small cap companies that haven't yet garnered significant analyst attention.
Diversify your portfolio with solid dividend payers offering reliable income streams to weather potential market turbulence.
Find companies with promising cash flow potential yet trading below their fair value.
This article by Simply Wall St is general in nature. We provide commentary based on historical data and analyst forecasts only using an unbiased methodology and our articles are not intended to be financial advice. It does not constitute a recommendation to buy or sell any stock, and does not take account of your objectives, or your financial situation. We aim to bring you long-term focused analysis driven by fundamental data. Note that our analysis may not factor in the latest price-sensitive company announcements or qualitative material. Simply Wall St has no position in any stocks mentioned.The analysis only considers stock directly held by insiders. It does not include indirectly owned stock through other vehicles such as corporate and/or trust entities. All forecast revenue and earnings growth rates quoted are in terms of annualised (per annum) growth rates over 1-3 years.
Companies discussed in this article include TSE:2181 TSE:4587 and TSE:4755.
Have feedback on this article? Concerned about the content? Get in touch with us directly. Alternatively, email editorial-team@simplywallst.com
