
 Yahoo Finance
 Those who invested in Symbotic (NASDAQ:SYM) a year ago are up 69%
Passive investing in index funds can generate returns that roughly match the overall market. But investors can boost returns by picking market-beating companies to own shares in. To wit, the Symbotic Inc. (NASDAQ:SYM) share price is 69% higher than it was a year ago, much better than the market decline of around 9.8% (not including dividends) in the same period. That's a solid performance by our standards! Note that businesses generally develop over the long term, so the returns over the last year might not reflect a long term trend.
Let's take a look at the underlying fundamentals over the longer term, and see if they've been consistent with shareholders returns.
View our latest analysis for Symbotic
While Symbotic made a small profit, in the last year, we think that the market is probably more focussed on the top line growth at the moment. Generally speaking, we'd consider a stock like this alongside loss-making companies, simply because the quantum of the profit is so low. For shareholders to have confidence a company will grow profits significantly, it must grow revenue.
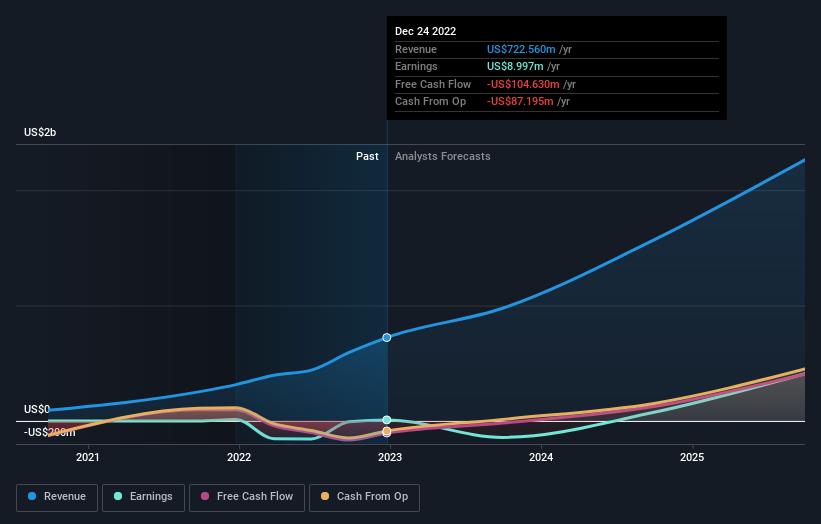
Over the last twelve months, Symbotic's revenue grew by 130%. That's well above most other pre-profit companies. While the share price gain of 69% over twelve months is pretty tasty, you might argue it doesn't fully reflect the strong revenue growth. If that's the case, now might be the time to take a close look at Symbotic. Since we evolved from monkeys, we think in linear terms by nature. So if growth goes exponential, opportunity may exist for the enlightened.
You can see below how earnings and revenue have changed over time (discover the exact values by clicking on the image).
Symbotic is well known by investors, and plenty of clever analysts have tried to predict the future profit levels. You can see what analysts are predicting for Symbotic in this interactive graph of future profit estimates.
A Different Perspective
Symbotic shareholders should be happy with the total gain of 69% over the last twelve months. A substantial portion of that gain has come in the last three months, with the stock up 52% in that time. Demand for the stock from multiple parties is pushing the price higher; it could be that word is getting out about its virtues as a business. It's always interesting to track share price performance over the longer term. But to understand Symbotic better, we need to consider many other factors. For example, we've discovered 3 warning signs for Symbotic (1 doesn't sit too well with us!) that you should be aware of before investing here.
If you like to buy stocks alongside management, then you might just love this free list of companies. (Hint: insiders have been buying them).
Please note, the market returns quoted in this article reflect the market weighted average returns of stocks that currently trade on US exchanges.
Have feedback on this article? Concerned about the content? Get in touch with us directly. Alternatively, email editorial-team (at) simplywallst.com.
This article by Simply Wall St is general in nature. We provide commentary based on historical data and analyst forecasts only using an unbiased methodology and our articles are not intended to be financial advice. It does not constitute a recommendation to buy or sell any stock, and does not take account of your objectives, or your financial situation. We aim to bring you long-term focused analysis driven by fundamental data. Note that our analysis may not factor in the latest price-sensitive company announcements or qualitative material. Simply Wall St has no position in any stocks mentioned.
Join A Paid User Research Session
You’ll receive a US$30 Amazon Gift card for 1 hour of your time while helping us build better investing tools for the individual investors like yourself. Sign up here
