
 Yahoo Finance
 Those who invested in Solarvest Holdings Berhad (KLSE:SLVEST) three years ago are up 47%
By buying an index fund, investors can approximate the average market return. But if you buy good businesses at attractive prices, your portfolio returns could exceed the average market return. Just take a look at Solarvest Holdings Berhad (KLSE:SLVEST), which is up 46%, over three years, soundly beating the market decline of 6.5% (not including dividends).
Now it's worth having a look at the company's fundamentals too, because that will help us determine if the long term shareholder return has matched the performance of the underlying business.
Check out our latest analysis for Solarvest Holdings Berhad
In his essay The Superinvestors of Graham-and-Doddsville Warren Buffett described how share prices do not always rationally reflect the value of a business. One way to examine how market sentiment has changed over time is to look at the interaction between a company's share price and its earnings per share (EPS).
During the three years of share price growth, Solarvest Holdings Berhad actually saw its earnings per share (EPS) drop 19% per year.
So we doubt that the market is looking to EPS for its main judge of the company's value. Since the change in EPS doesn't seem to correlate with the change in share price, it's worth taking a look at other metrics.
Languishing at just 1.2%, we doubt the dividend is doing much to prop up the share price. You can only imagine how long term shareholders feel about the declining revenue trend (slipping at per year). The only thing that's clear is there is low correlation between Solarvest Holdings Berhad's share price and its historic fundamental data. Further research may be required!
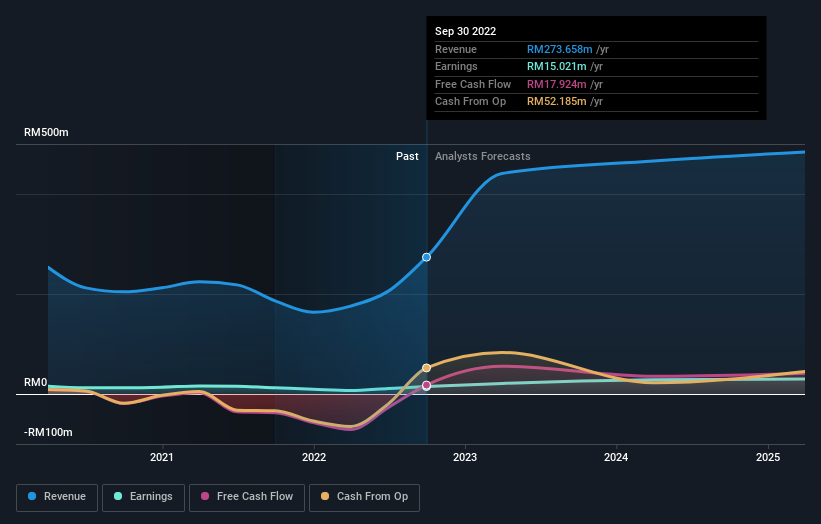
The company's revenue and earnings (over time) are depicted in the image below (click to see the exact numbers).
We know that Solarvest Holdings Berhad has improved its bottom line lately, but what does the future have in store? This free report showing analyst forecasts should help you form a view on Solarvest Holdings Berhad
A Different Perspective
The last twelve months weren't great for Solarvest Holdings Berhad shares, which cost holders 30%, including dividends, while the market was up about 1.3%. Of course the long term matters more than the short term, and even great stocks will sometimes have a poor year. Investors are up over three years, booking 14% per year, much better than the more recent returns. Sometimes when a good quality long term winner has a weak period, it's turns out to be an opportunity, but you really need to be sure that the quality is there. Before deciding if you like the current share price, check how Solarvest Holdings Berhad scores on these 3 valuation metrics.
We will like Solarvest Holdings Berhad better if we see some big insider buys. While we wait, check out this free list of growing companies with considerable, recent, insider buying.
Please note, the market returns quoted in this article reflect the market weighted average returns of stocks that currently trade on MY exchanges.
Have feedback on this article? Concerned about the content? Get in touch with us directly. Alternatively, email editorial-team (at) simplywallst.com.
This article by Simply Wall St is general in nature. We provide commentary based on historical data and analyst forecasts only using an unbiased methodology and our articles are not intended to be financial advice. It does not constitute a recommendation to buy or sell any stock, and does not take account of your objectives, or your financial situation. We aim to bring you long-term focused analysis driven by fundamental data. Note that our analysis may not factor in the latest price-sensitive company announcements or qualitative material. Simply Wall St has no position in any stocks mentioned.
Join A Paid User Research Session
You’ll receive a US$30 Amazon Gift card for 1 hour of your time while helping us build better investing tools for the individual investors like yourself. Sign up here
