
 Yahoo Finance
 Those who invested in RELX (LON:REL) five years ago are up 135%
When you buy a stock there is always a possibility that it could drop 100%. But when you pick a company that is really flourishing, you can make more than 100%. One great example is RELX PLC (LON:REL) which saw its share price drive 109% higher over five years.
So let's assess the underlying fundamentals over the last 5 years and see if they've moved in lock-step with shareholder returns.
Check out our latest analysis for RELX
While the efficient markets hypothesis continues to be taught by some, it has been proven that markets are over-reactive dynamic systems, and investors are not always rational. One way to examine how market sentiment has changed over time is to look at the interaction between a company's share price and its earnings per share (EPS).
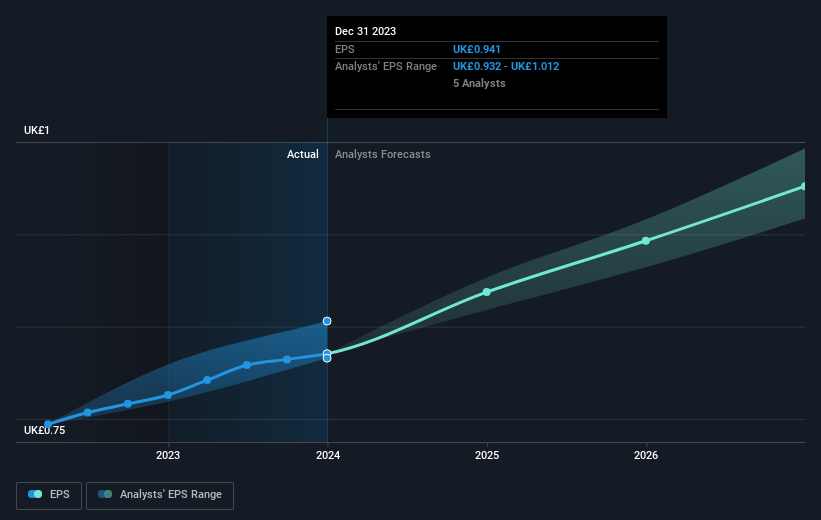
During five years of share price growth, RELX achieved compound earnings per share (EPS) growth of 5.7% per year. This EPS growth is lower than the 16% average annual increase in the share price. This suggests that market participants hold the company in higher regard, these days. That's not necessarily surprising considering the five-year track record of earnings growth.
You can see below how EPS has changed over time (discover the exact values by clicking on the image).
We know that RELX has improved its bottom line lately, but is it going to grow revenue? If you're interested, you could check this free report showing consensus revenue forecasts.
What About Dividends?
When looking at investment returns, it is important to consider the difference between total shareholder return (TSR) and share price return. The TSR incorporates the value of any spin-offs or discounted capital raisings, along with any dividends, based on the assumption that the dividends are reinvested. Arguably, the TSR gives a more comprehensive picture of the return generated by a stock. In the case of RELX, it has a TSR of 135% for the last 5 years. That exceeds its share price return that we previously mentioned. And there's no prize for guessing that the dividend payments largely explain the divergence!
A Different Perspective
It's good to see that RELX has rewarded shareholders with a total shareholder return of 32% in the last twelve months. Of course, that includes the dividend. That gain is better than the annual TSR over five years, which is 19%. Therefore it seems like sentiment around the company has been positive lately. Given the share price momentum remains strong, it might be worth taking a closer look at the stock, lest you miss an opportunity. It's always interesting to track share price performance over the longer term. But to understand RELX better, we need to consider many other factors. Consider for instance, the ever-present spectre of investment risk. We've identified 2 warning signs with RELX , and understanding them should be part of your investment process.
Of course, you might find a fantastic investment by looking elsewhere. So take a peek at this free list of companies we expect will grow earnings.
Please note, the market returns quoted in this article reflect the market weighted average returns of stocks that currently trade on British exchanges.
Have feedback on this article? Concerned about the content? Get in touch with us directly. Alternatively, email editorial-team (at) simplywallst.com.
This article by Simply Wall St is general in nature. We provide commentary based on historical data and analyst forecasts only using an unbiased methodology and our articles are not intended to be financial advice. It does not constitute a recommendation to buy or sell any stock, and does not take account of your objectives, or your financial situation. We aim to bring you long-term focused analysis driven by fundamental data. Note that our analysis may not factor in the latest price-sensitive company announcements or qualitative material. Simply Wall St has no position in any stocks mentioned.
