
 Yahoo Finance
 Those who invested in Quest Diagnostics (NYSE:DGX) five years ago are up 86%
When you buy and hold a stock for the long term, you definitely want it to provide a positive return. But more than that, you probably want to see it rise more than the market average. But Quest Diagnostics Incorporated (NYSE:DGX) has fallen short of that second goal, with a share price rise of 68% over five years, which is below the market return. Over the last twelve months the stock price has risen a very respectable 19%.
With that in mind, it's worth seeing if the company's underlying fundamentals have been the driver of long term performance, or if there are some discrepancies.
View our latest analysis for Quest Diagnostics
While markets are a powerful pricing mechanism, share prices reflect investor sentiment, not just underlying business performance. One imperfect but simple way to consider how the market perception of a company has shifted is to compare the change in the earnings per share (EPS) with the share price movement.
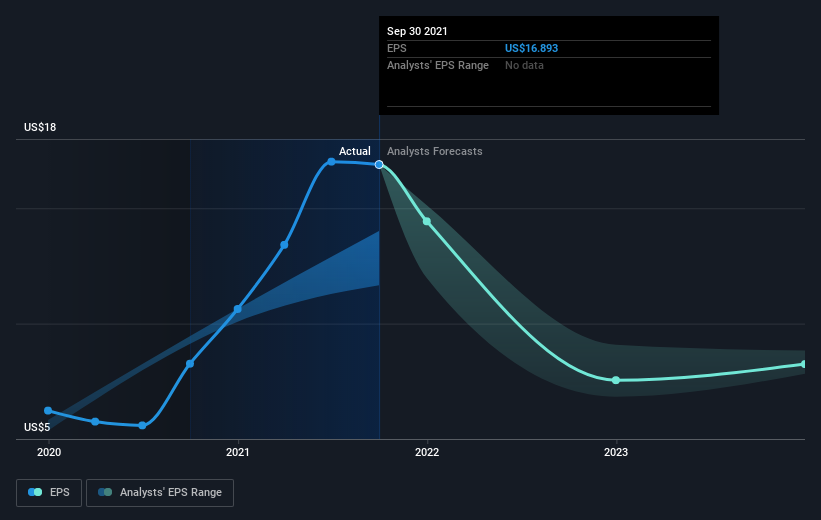
During five years of share price growth, Quest Diagnostics achieved compound earnings per share (EPS) growth of 30% per year. The EPS growth is more impressive than the yearly share price gain of 11% over the same period. So it seems the market isn't so enthusiastic about the stock these days. The reasonably low P/E ratio of 8.37 also suggests market apprehension.
The image below shows how EPS has tracked over time (if you click on the image you can see greater detail).
It is of course excellent to see how Quest Diagnostics has grown profits over the years, but the future is more important for shareholders. You can see how its balance sheet has strengthened (or weakened) over time in this free interactive graphic.
What About Dividends?
When looking at investment returns, it is important to consider the difference between total shareholder return (TSR) and share price return. Whereas the share price return only reflects the change in the share price, the TSR includes the value of dividends (assuming they were reinvested) and the benefit of any discounted capital raising or spin-off. Arguably, the TSR gives a more comprehensive picture of the return generated by a stock. As it happens, Quest Diagnostics' TSR for the last 5 years was 86%, which exceeds the share price return mentioned earlier. The dividends paid by the company have thusly boosted the total shareholder return.
A Different Perspective
Quest Diagnostics provided a TSR of 21% over the last twelve months. But that return falls short of the market. The silver lining is that the gain was actually better than the average annual return of 13% per year over five year. This could indicate that the company is winning over new investors, as it pursues its strategy. It's always interesting to track share price performance over the longer term. But to understand Quest Diagnostics better, we need to consider many other factors. Case in point: We've spotted 2 warning signs for Quest Diagnostics you should be aware of, and 1 of them makes us a bit uncomfortable.
For those who like to find winning investments this free list of growing companies with recent insider purchasing, could be just the ticket.
Please note, the market returns quoted in this article reflect the market weighted average returns of stocks that currently trade on US exchanges.
This article by Simply Wall St is general in nature. We provide commentary based on historical data and analyst forecasts only using an unbiased methodology and our articles are not intended to be financial advice. It does not constitute a recommendation to buy or sell any stock, and does not take account of your objectives, or your financial situation. We aim to bring you long-term focused analysis driven by fundamental data. Note that our analysis may not factor in the latest price-sensitive company announcements or qualitative material. Simply Wall St has no position in any stocks mentioned.
Have feedback on this article? Concerned about the content? Get in touch with us directly. Alternatively, email editorial-team (at) simplywallst.com.
