
 Yahoo Finance
 Those who invested in Pearson (LON:PSON) five years ago are up 37%
When we invest, we're generally looking for stocks that outperform the market average. Buying under-rated businesses is one path to excess returns. For example, the Pearson plc (LON:PSON) share price is up 20% in the last 5 years, clearly besting the market return of around 5.9% (ignoring dividends).
So let's investigate and see if the longer term performance of the company has been in line with the underlying business' progress.
View our latest analysis for Pearson
While markets are a powerful pricing mechanism, share prices reflect investor sentiment, not just underlying business performance. One imperfect but simple way to consider how the market perception of a company has shifted is to compare the change in the earnings per share (EPS) with the share price movement.
During five years of share price growth, Pearson actually saw its EPS drop 5.6% per year.
Since the EPS are down strongly, it seems highly unlikely market participants are looking at EPS to value the company. The falling EPS doesn't correlate with the climbing share price, so it's worth taking a look at other metrics.
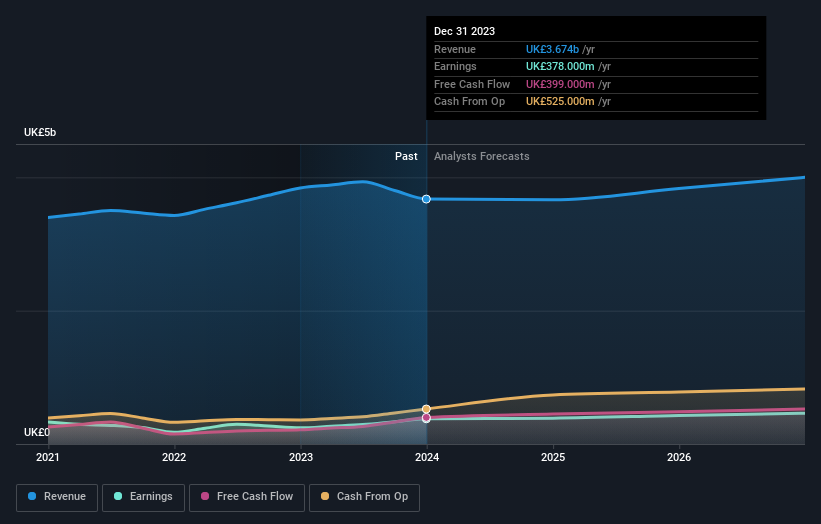
It is not great to see that revenue has dropped by 1.2% per year over five years. So it seems one might have to take closer look at earnings and revenue trends to see how they might influence the share price.
The company's revenue and earnings (over time) are depicted in the image below (click to see the exact numbers).
We know that Pearson has improved its bottom line lately, but what does the future have in store? This free report showing analyst forecasts should help you form a view on Pearson
What About Dividends?
As well as measuring the share price return, investors should also consider the total shareholder return (TSR). Whereas the share price return only reflects the change in the share price, the TSR includes the value of dividends (assuming they were reinvested) and the benefit of any discounted capital raising or spin-off. So for companies that pay a generous dividend, the TSR is often a lot higher than the share price return. We note that for Pearson the TSR over the last 5 years was 37%, which is better than the share price return mentioned above. The dividends paid by the company have thusly boosted the total shareholder return.
A Different Perspective
It's good to see that Pearson has rewarded shareholders with a total shareholder return of 21% in the last twelve months. Of course, that includes the dividend. Since the one-year TSR is better than the five-year TSR (the latter coming in at 7% per year), it would seem that the stock's performance has improved in recent times. In the best case scenario, this may hint at some real business momentum, implying that now could be a great time to delve deeper. I find it very interesting to look at share price over the long term as a proxy for business performance. But to truly gain insight, we need to consider other information, too. Case in point: We've spotted 1 warning sign for Pearson you should be aware of.
Of course, you might find a fantastic investment by looking elsewhere. So take a peek at this free list of companies we expect will grow earnings.
Please note, the market returns quoted in this article reflect the market weighted average returns of stocks that currently trade on British exchanges.
Have feedback on this article? Concerned about the content? Get in touch with us directly. Alternatively, email editorial-team (at) simplywallst.com.
This article by Simply Wall St is general in nature. We provide commentary based on historical data and analyst forecasts only using an unbiased methodology and our articles are not intended to be financial advice. It does not constitute a recommendation to buy or sell any stock, and does not take account of your objectives, or your financial situation. We aim to bring you long-term focused analysis driven by fundamental data. Note that our analysis may not factor in the latest price-sensitive company announcements or qualitative material. Simply Wall St has no position in any stocks mentioned.
