
 Yahoo Finance
 Those who invested in NN Group (AMS:NN) five years ago are up 60%
The main point of investing for the long term is to make money. Furthermore, you'd generally like to see the share price rise faster than the market. Unfortunately for shareholders, while the NN Group N.V. (AMS:NN) share price is up 21% in the last five years, that's less than the market return. However, if you include the dividends then the return is market beating. Unfortunately the share price is down 8.5% in the last year.
Let's take a look at the underlying fundamentals over the longer term, and see if they've been consistent with shareholders returns.
View our latest analysis for NN Group
In his essay The Superinvestors of Graham-and-Doddsville Warren Buffett described how share prices do not always rationally reflect the value of a business. One way to examine how market sentiment has changed over time is to look at the interaction between a company's share price and its earnings per share (EPS).
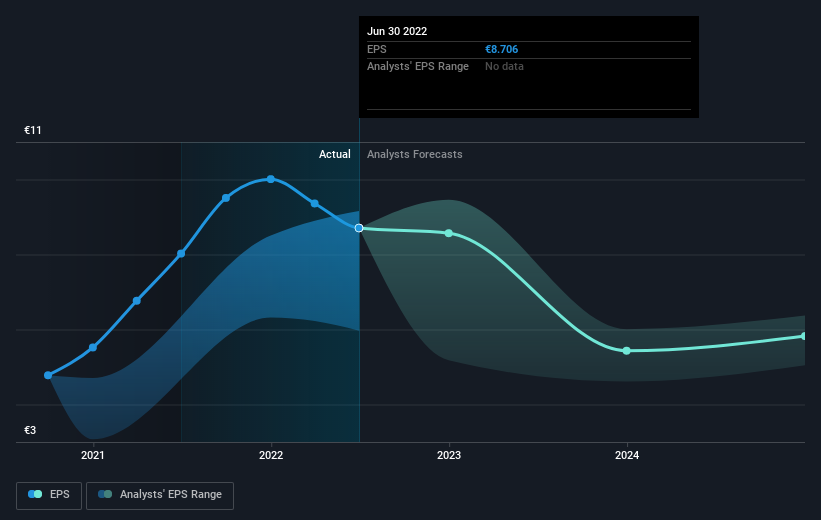
During five years of share price growth, NN Group achieved compound earnings per share (EPS) growth of 18% per year. The EPS growth is more impressive than the yearly share price gain of 4% over the same period. So it seems the market isn't so enthusiastic about the stock these days. The reasonably low P/E ratio of 5.00 also suggests market apprehension.
The graphic below depicts how EPS has changed over time (unveil the exact values by clicking on the image).
This free interactive report on NN Group's earnings, revenue and cash flow is a great place to start, if you want to investigate the stock further.
What About Dividends?
As well as measuring the share price return, investors should also consider the total shareholder return (TSR). The TSR is a return calculation that accounts for the value of cash dividends (assuming that any dividend received was reinvested) and the calculated value of any discounted capital raisings and spin-offs. Arguably, the TSR gives a more comprehensive picture of the return generated by a stock. As it happens, NN Group's TSR for the last 5 years was 60%, which exceeds the share price return mentioned earlier. This is largely a result of its dividend payments!
A Different Perspective
While it's never nice to take a loss, NN Group shareholders can take comfort that , including dividends,their trailing twelve month loss of 3.1% wasn't as bad as the market loss of around 27%. Of course, the long term returns are far more important and the good news is that over five years, the stock has returned 10% for each year. In the best case scenario the last year is just a temporary blip on the journey to a brighter future. I find it very interesting to look at share price over the long term as a proxy for business performance. But to truly gain insight, we need to consider other information, too. For example, we've discovered 3 warning signs for NN Group (2 don't sit too well with us!) that you should be aware of before investing here.
If you are like me, then you will not want to miss this free list of growing companies that insiders are buying.
Please note, the market returns quoted in this article reflect the market weighted average returns of stocks that currently trade on NL exchanges.
Have feedback on this article? Concerned about the content? Get in touch with us directly. Alternatively, email editorial-team (at) simplywallst.com.
This article by Simply Wall St is general in nature. We provide commentary based on historical data and analyst forecasts only using an unbiased methodology and our articles are not intended to be financial advice. It does not constitute a recommendation to buy or sell any stock, and does not take account of your objectives, or your financial situation. We aim to bring you long-term focused analysis driven by fundamental data. Note that our analysis may not factor in the latest price-sensitive company announcements or qualitative material. Simply Wall St has no position in any stocks mentioned.
Join A Paid User Research Session
You’ll receive a US$30 Amazon Gift card for 1 hour of your time while helping us build better investing tools for the individual investors like yourself. Sign up here
