
 Yahoo Finance
 Those who invested in McMillan Shakespeare (ASX:MMS) three years ago are up 119%
It might be of some concern to shareholders to see the McMillan Shakespeare Limited (ASX:MMS) share price down 11% in the last month. But that shouldn't obscure the pleasing returns achieved by shareholders over the last three years. In fact, the company's share price bested the return of its market index in that time, posting a gain of 75%.
So let's investigate and see if the longer term performance of the company has been in line with the underlying business' progress.
See our latest analysis for McMillan Shakespeare
To quote Buffett, 'Ships will sail around the world but the Flat Earth Society will flourish. There will continue to be wide discrepancies between price and value in the marketplace...' By comparing earnings per share (EPS) and share price changes over time, we can get a feel for how investor attitudes to a company have morphed over time.
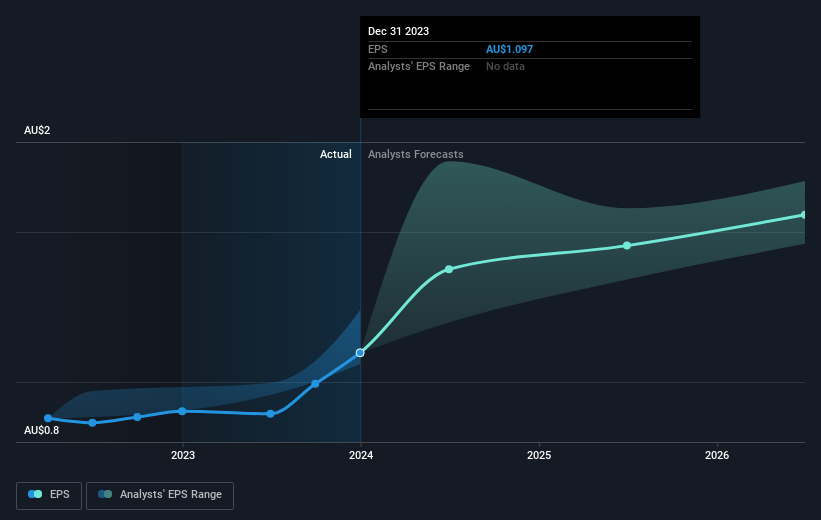
McMillan Shakespeare became profitable within the last three years. That would generally be considered a positive, so we'd expect the share price to be up.
The graphic below depicts how EPS has changed over time (unveil the exact values by clicking on the image).
It is of course excellent to see how McMillan Shakespeare has grown profits over the years, but the future is more important for shareholders. Take a more thorough look at McMillan Shakespeare's financial health with this free report on its balance sheet.
What About Dividends?
When looking at investment returns, it is important to consider the difference between total shareholder return (TSR) and share price return. The TSR incorporates the value of any spin-offs or discounted capital raisings, along with any dividends, based on the assumption that the dividends are reinvested. So for companies that pay a generous dividend, the TSR is often a lot higher than the share price return. As it happens, McMillan Shakespeare's TSR for the last 3 years was 119%, which exceeds the share price return mentioned earlier. This is largely a result of its dividend payments!
A Different Perspective
We're pleased to report that McMillan Shakespeare shareholders have received a total shareholder return of 41% over one year. Of course, that includes the dividend. That's better than the annualised return of 17% over half a decade, implying that the company is doing better recently. In the best case scenario, this may hint at some real business momentum, implying that now could be a great time to delve deeper. While it is well worth considering the different impacts that market conditions can have on the share price, there are other factors that are even more important. For example, we've discovered 3 warning signs for McMillan Shakespeare that you should be aware of before investing here.
We will like McMillan Shakespeare better if we see some big insider buys. While we wait, check out this free list of growing companies with considerable, recent, insider buying.
Please note, the market returns quoted in this article reflect the market weighted average returns of stocks that currently trade on Australian exchanges.
Have feedback on this article? Concerned about the content? Get in touch with us directly. Alternatively, email editorial-team (at) simplywallst.com.
This article by Simply Wall St is general in nature. We provide commentary based on historical data and analyst forecasts only using an unbiased methodology and our articles are not intended to be financial advice. It does not constitute a recommendation to buy or sell any stock, and does not take account of your objectives, or your financial situation. We aim to bring you long-term focused analysis driven by fundamental data. Note that our analysis may not factor in the latest price-sensitive company announcements or qualitative material. Simply Wall St has no position in any stocks mentioned.
