
 Yahoo Finance
 Those who invested in LKQ (NASDAQ:LKQ) three years ago are up 59%
One simple way to benefit from the stock market is to buy an index fund. But many of us dare to dream of bigger returns, and build a portfolio ourselves. For example, LKQ Corporation (NASDAQ:LKQ) shareholders have seen the share price rise 55% over three years, well in excess of the market return (25%, not including dividends).
Now it's worth having a look at the company's fundamentals too, because that will help us determine if the long term shareholder return has matched the performance of the underlying business.
View our latest analysis for LKQ
To quote Buffett, 'Ships will sail around the world but the Flat Earth Society will flourish. There will continue to be wide discrepancies between price and value in the marketplace...' One flawed but reasonable way to assess how sentiment around a company has changed is to compare the earnings per share (EPS) with the share price.
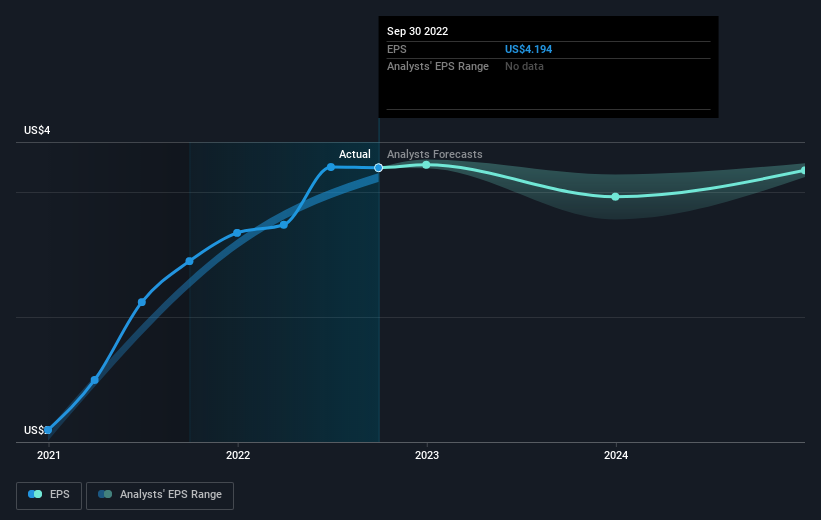
During three years of share price growth, LKQ achieved compound earnings per share growth of 47% per year. This EPS growth is higher than the 16% average annual increase in the share price. So it seems investors have become more cautious about the company, over time.
The graphic below depicts how EPS has changed over time (unveil the exact values by clicking on the image).
It is of course excellent to see how LKQ has grown profits over the years, but the future is more important for shareholders. This free interactive report on LKQ's balance sheet strength is a great place to start, if you want to investigate the stock further.
What About Dividends?
When looking at investment returns, it is important to consider the difference between total shareholder return (TSR) and share price return. Whereas the share price return only reflects the change in the share price, the TSR includes the value of dividends (assuming they were reinvested) and the benefit of any discounted capital raising or spin-off. Arguably, the TSR gives a more comprehensive picture of the return generated by a stock. We note that for LKQ the TSR over the last 3 years was 59%, which is better than the share price return mentioned above. This is largely a result of its dividend payments!
A Different Perspective
While it's certainly disappointing to see that LKQ shares lost 2.8% throughout the year, that wasn't as bad as the market loss of 17%. Of course, the long term returns are far more important and the good news is that over five years, the stock has returned 7% for each year. In the best case scenario the last year is just a temporary blip on the journey to a brighter future. It's always interesting to track share price performance over the longer term. But to understand LKQ better, we need to consider many other factors. For instance, we've identified 3 warning signs for LKQ (1 is concerning) that you should be aware of.
If you are like me, then you will not want to miss this free list of growing companies that insiders are buying.
Please note, the market returns quoted in this article reflect the market weighted average returns of stocks that currently trade on US exchanges.
Have feedback on this article? Concerned about the content? Get in touch with us directly. Alternatively, email editorial-team (at) simplywallst.com.
This article by Simply Wall St is general in nature. We provide commentary based on historical data and analyst forecasts only using an unbiased methodology and our articles are not intended to be financial advice. It does not constitute a recommendation to buy or sell any stock, and does not take account of your objectives, or your financial situation. We aim to bring you long-term focused analysis driven by fundamental data. Note that our analysis may not factor in the latest price-sensitive company announcements or qualitative material. Simply Wall St has no position in any stocks mentioned.
Join A Paid User Research Session
You’ll receive a US$30 Amazon Gift card for 1 hour of your time while helping us build better investing tools for the individual investors like yourself. Sign up here
