
 Yahoo Finance
 Those who invested in kneat.com (TSE:KSI) five years ago are up 172%
The most you can lose on any stock (assuming you don't use leverage) is 100% of your money. But on the bright side, if you buy shares in a high quality company at the right price, you can gain well over 100%. Long term kneat.com, inc. (TSE:KSI) shareholders would be well aware of this, since the stock is up 172% in five years.
So let's investigate and see if the longer term performance of the company has been in line with the underlying business' progress.
See our latest analysis for kneat.com
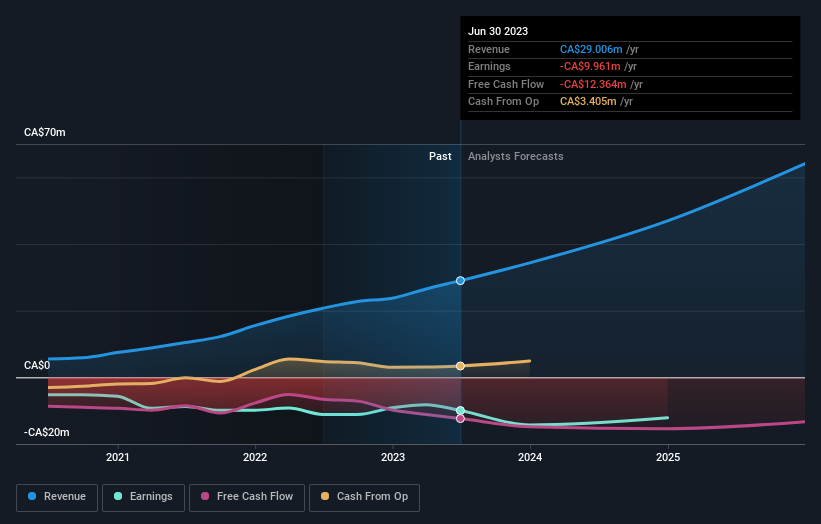
Because kneat.com made a loss in the last twelve months, we think the market is probably more focussed on revenue and revenue growth, at least for now. Shareholders of unprofitable companies usually expect strong revenue growth. That's because fast revenue growth can be easily extrapolated to forecast profits, often of considerable size.
In the last 5 years kneat.com saw its revenue grow at 54% per year. Even measured against other revenue-focussed companies, that's a good result. Meanwhile, its share price performance certainly reflects the strong growth, given the share price grew at 22% per year, compound, during the period. So it seems likely that buyers have paid attention to the strong revenue growth. kneat.com seems like a high growth stock - so growth investors might want to add it to their watchlist.
You can see how earnings and revenue have changed over time in the image below (click on the chart to see the exact values).
We consider it positive that insiders have made significant purchases in the last year. Having said that, most people consider earnings and revenue growth trends to be a more meaningful guide to the business. If you are thinking of buying or selling kneat.com stock, you should check out this free report showing analyst profit forecasts.
A Different Perspective
We're pleased to report that kneat.com shareholders have received a total shareholder return of 17% over one year. However, that falls short of the 22% TSR per annum it has made for shareholders, each year, over five years. I find it very interesting to look at share price over the long term as a proxy for business performance. But to truly gain insight, we need to consider other information, too. Case in point: We've spotted 4 warning signs for kneat.com you should be aware of, and 2 of them are a bit unpleasant.
There are plenty of other companies that have insiders buying up shares. You probably do not want to miss this free list of growing companies that insiders are buying.
Please note, the market returns quoted in this article reflect the market weighted average returns of stocks that currently trade on Canadian exchanges.
Have feedback on this article? Concerned about the content? Get in touch with us directly. Alternatively, email editorial-team (at) simplywallst.com.
This article by Simply Wall St is general in nature. We provide commentary based on historical data and analyst forecasts only using an unbiased methodology and our articles are not intended to be financial advice. It does not constitute a recommendation to buy or sell any stock, and does not take account of your objectives, or your financial situation. We aim to bring you long-term focused analysis driven by fundamental data. Note that our analysis may not factor in the latest price-sensitive company announcements or qualitative material. Simply Wall St has no position in any stocks mentioned.
