
 Yahoo Finance
 Those who invested in Home Depot (NYSE:HD) five years ago are up 73%
The Home Depot, Inc. (NYSE:HD) shareholders might be concerned after seeing the share price drop 13% in the last quarter. On the bright side the share price is up over the last half decade. However we are not very impressed because the share price is only up 53%, less than the market return of 60%.
So let's assess the underlying fundamentals over the last 5 years and see if they've moved in lock-step with shareholder returns.
See our latest analysis for Home Depot
While the efficient markets hypothesis continues to be taught by some, it has been proven that markets are over-reactive dynamic systems, and investors are not always rational. One way to examine how market sentiment has changed over time is to look at the interaction between a company's share price and its earnings per share (EPS).
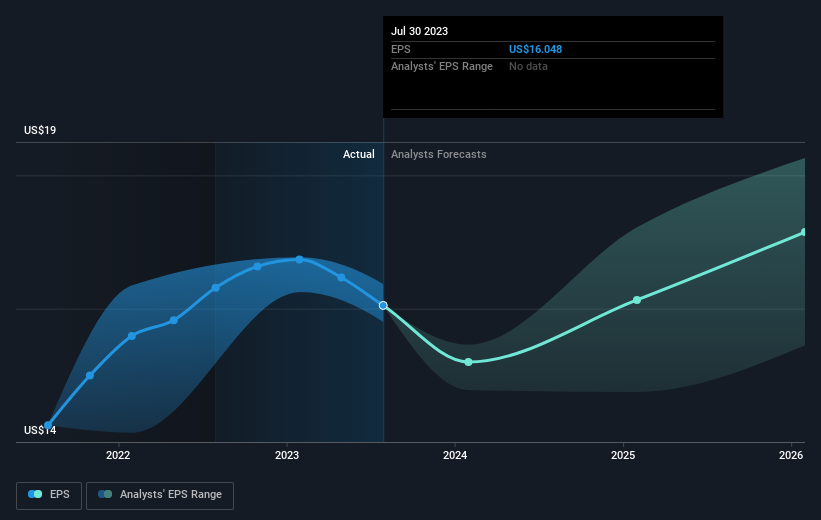
Over half a decade, Home Depot managed to grow its earnings per share at 14% a year. This EPS growth is higher than the 9% average annual increase in the share price. Therefore, it seems the market has become relatively pessimistic about the company.
You can see below how EPS has changed over time (discover the exact values by clicking on the image).
We consider it positive that insiders have made significant purchases in the last year. Having said that, most people consider earnings and revenue growth trends to be a more meaningful guide to the business. This free interactive report on Home Depot's earnings, revenue and cash flow is a great place to start, if you want to investigate the stock further.
What About Dividends?
As well as measuring the share price return, investors should also consider the total shareholder return (TSR). The TSR is a return calculation that accounts for the value of cash dividends (assuming that any dividend received was reinvested) and the calculated value of any discounted capital raisings and spin-offs. Arguably, the TSR gives a more comprehensive picture of the return generated by a stock. We note that for Home Depot the TSR over the last 5 years was 73%, which is better than the share price return mentioned above. And there's no prize for guessing that the dividend payments largely explain the divergence!
A Different Perspective
Home Depot shareholders are up 2.0% for the year (even including dividends). Unfortunately this falls short of the market return. If we look back over five years, the returns are even better, coming in at 12% per year for five years. Maybe the share price is just taking a breather while the business executes on its growth strategy. While it is well worth considering the different impacts that market conditions can have on the share price, there are other factors that are even more important. Consider for instance, the ever-present spectre of investment risk. We've identified 2 warning signs with Home Depot , and understanding them should be part of your investment process.
There are plenty of other companies that have insiders buying up shares. You probably do not want to miss this free list of growing companies that insiders are buying.
Please note, the market returns quoted in this article reflect the market weighted average returns of stocks that currently trade on American exchanges.
Have feedback on this article? Concerned about the content? Get in touch with us directly. Alternatively, email editorial-team (at) simplywallst.com.
This article by Simply Wall St is general in nature. We provide commentary based on historical data and analyst forecasts only using an unbiased methodology and our articles are not intended to be financial advice. It does not constitute a recommendation to buy or sell any stock, and does not take account of your objectives, or your financial situation. We aim to bring you long-term focused analysis driven by fundamental data. Note that our analysis may not factor in the latest price-sensitive company announcements or qualitative material. Simply Wall St has no position in any stocks mentioned.
