
 Yahoo Finance
 Those who invested in Héroux-Devtek (TSE:HRX) a year ago are up 39%
Passive investing in index funds can generate returns that roughly match the overall market. But you can significantly boost your returns by picking above-average stocks. To wit, the Héroux-Devtek Inc. (TSE:HRX) share price is 39% higher than it was a year ago, much better than the market return of around 8.0% (not including dividends) in the same period. So that should have shareholders smiling. However, the stock hasn't done so well in the longer term, with the stock only up 7.2% in three years.
So let's investigate and see if the longer term performance of the company has been in line with the underlying business' progress.
See our latest analysis for Héroux-Devtek
There is no denying that markets are sometimes efficient, but prices do not always reflect underlying business performance. One imperfect but simple way to consider how the market perception of a company has shifted is to compare the change in the earnings per share (EPS) with the share price movement.
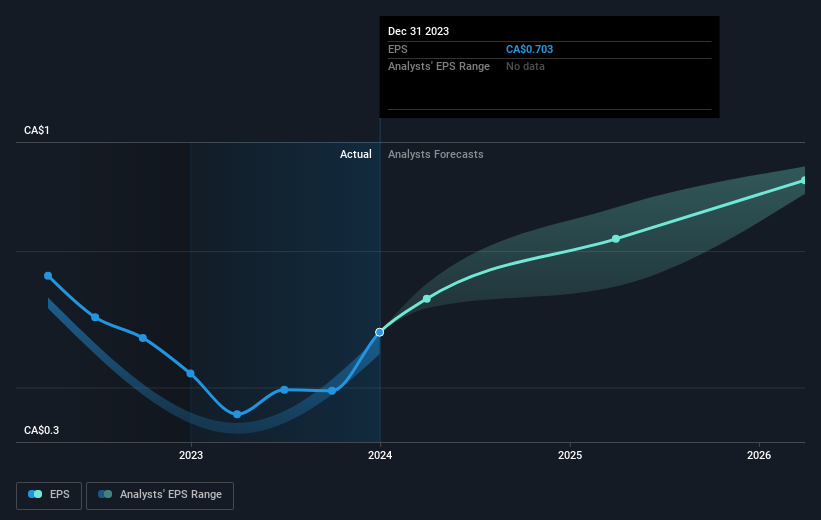
During the last year Héroux-Devtek grew its earnings per share (EPS) by 28%. This EPS growth is significantly lower than the 39% increase in the share price. So it's fair to assume the market has a higher opinion of the business than it a year ago.
The image below shows how EPS has tracked over time (if you click on the image you can see greater detail).
We know that Héroux-Devtek has improved its bottom line over the last three years, but what does the future have in store? You can see how its balance sheet has strengthened (or weakened) over time in this free interactive graphic.
A Different Perspective
We're pleased to report that Héroux-Devtek shareholders have received a total shareholder return of 39% over one year. That gain is better than the annual TSR over five years, which is 1.9%. Therefore it seems like sentiment around the company has been positive lately. Given the share price momentum remains strong, it might be worth taking a closer look at the stock, lest you miss an opportunity. I find it very interesting to look at share price over the long term as a proxy for business performance. But to truly gain insight, we need to consider other information, too. Take risks, for example - Héroux-Devtek has 1 warning sign we think you should be aware of.
If you like to buy stocks alongside management, then you might just love this free list of companies. (Hint: insiders have been buying them).
Please note, the market returns quoted in this article reflect the market weighted average returns of stocks that currently trade on Canadian exchanges.
Have feedback on this article? Concerned about the content? Get in touch with us directly. Alternatively, email editorial-team (at) simplywallst.com.
This article by Simply Wall St is general in nature. We provide commentary based on historical data and analyst forecasts only using an unbiased methodology and our articles are not intended to be financial advice. It does not constitute a recommendation to buy or sell any stock, and does not take account of your objectives, or your financial situation. We aim to bring you long-term focused analysis driven by fundamental data. Note that our analysis may not factor in the latest price-sensitive company announcements or qualitative material. Simply Wall St has no position in any stocks mentioned.
